State’s COVID-19 Surge Has Passed
But will it return? The data tells a story of what we might expect.

2019 Novel Coronavirus. Image by the Centers for Disease Control and Prevention.
Why did Wisconsin surrender to COVID-19 this fall? To answer this question it’s useful to examine Wisconsin’s experience last year.
The chart below tracks the 7-day average of daily cases of COVID-19 since mid-March of last year for both Wisconsin and the United States as a whole. Note that these values are expressed as cases per 100,000 residents. This allows the comparison of geographical entities with varying populations.
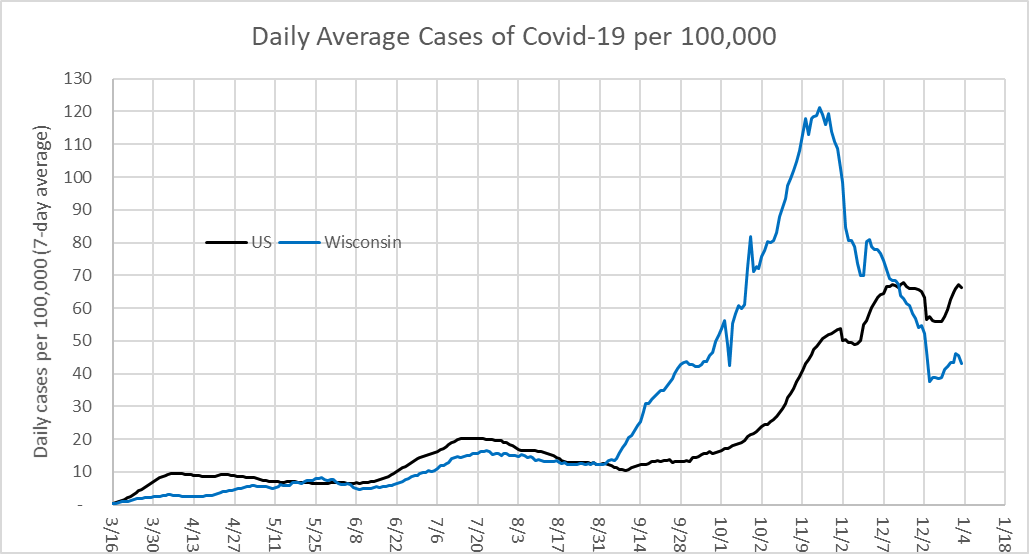
Daily Average Cases of COVID-19 per 100,000
For reasons that are unclear to me, Wisconsin cases took off around the middle of September. For several weeks Wisconsin was third in the nation with respect to new cases of COVID-19, following only North Dakota and South Dakota.
At its peak the number of new cases surpassed 120 new infections per 100,000 residents every day, about double the rate for the nation as a whole at the time. In other words, about 0.1 percent of Wisconsinites were infected every day at the peak. If this peak infection rate had been maintained long-term, 3 percent of Wisconsinites would be infected every month.
On the chart, the extreme magnitude of this surge makes the earlier spring and summer peaks seem miniscule. This difference may partly reflect increased testing as the year went on.Compared to other Great Lakes states, Wisconsin led the way in the surge of infections, as can be seen in the next graph. Eventually, however, the other Great Lakes states had their own COVID-19 peaks—but with a month’s delay compared to Wisconsin.
Since peaking, the COVID-19 rate in all six states has fallen substantially. For instance, Wisconsin has gone from a rate substantially higher than the nation as a whole to one well below. However, the recent uptick is concerning.
While Wisconsin’s current infection rate in the 40s per 100,000 is certainly an improvement and better than the national average, it is still very dangerous. For example, New York used a rate of 10 per 100,000 in a traveler’s home state to determine whether to require that traveler to be quarantined. Chicago applied a rate of 15 per 100,000 when applying its quarantine rules.

Per Capita COVID-19 Daily Cases Great Lakes States
Hospitalizations in Wisconsin peaked shortly after cases peaked and then declined as cases declined.
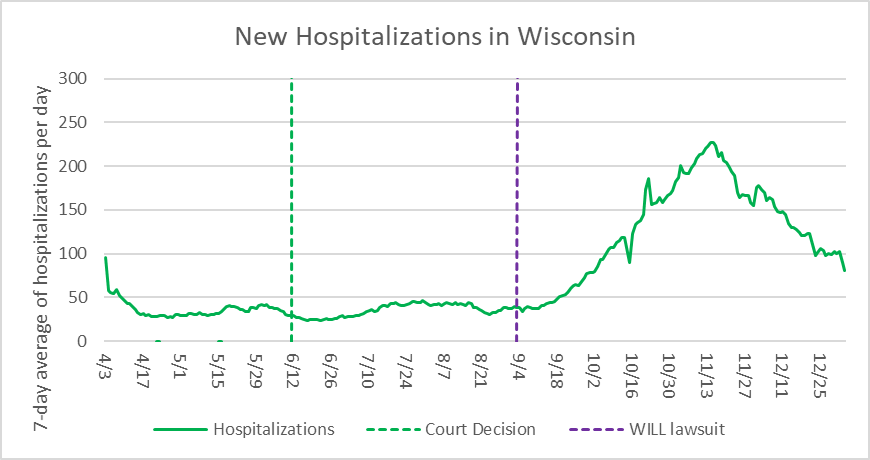
New Hospitalizations in Wisconsin
About three weeks following the start of the start of the rise in Wisconsin COVID-19 cases in early September, deaths from the disease started their own rise, as shown in the graph below. This peak was followed by a sharp and welcome decline in the death rate.
Note that the last few data points are subject to change. The seven-day average takes the value for the day itself, the three days preceding it, and the three following. As the latter three come in, the average may change. In addition, the New Year’s holiday, which this year stretched over four days, is likely to have caused a delay in reporting.
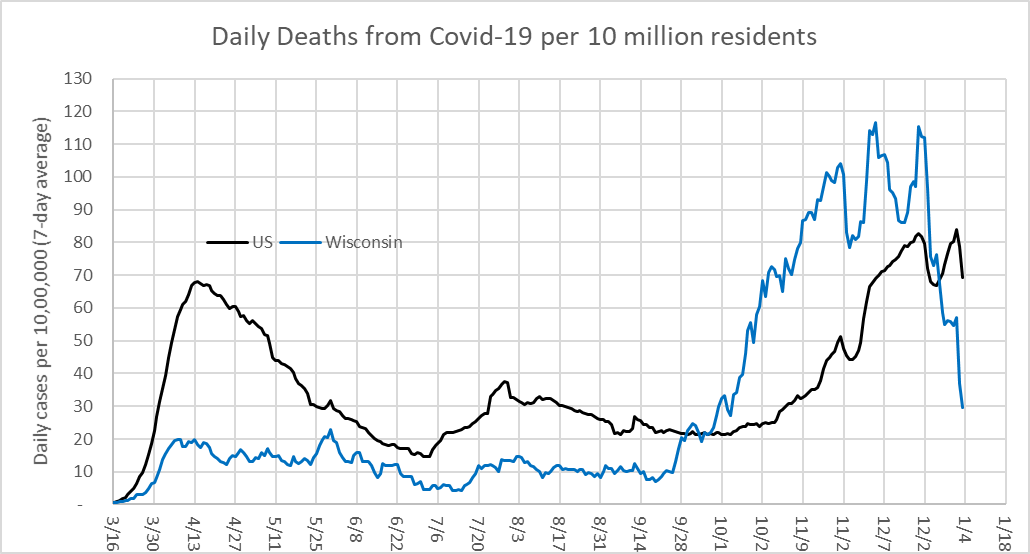
Daily Deaths from COVID-19 per 10 million residents
Another way to visualize the continuously changing Wisconsin situation is through the reproduction rate Rt of the virus. To how many people, on average, does the average infected Wisconsinite transmit the virus? If it is more than one, the virus is spreading. If less, the virus will eventually go away.
The graph below shows one model’s estimate of Rt for Wisconsin over time. Recently, its estimated value has been below one, which, if maintained, implies that the virus’ grip is shrinking in Wisconsin. Currently Wisconsin’s Rt value is .9. While hardly impressive when compared to many countries, this puts Wisconsin ahead of all other US states. Forty three of the 49 other states have Rt values greater than one, reflecting growing infection rates. The danger is that people in Wisconsin will take the improving situation as a signal to avoid social distancing and mask, pushing the Rt value over 1 and triggering another spike in the pandemic.
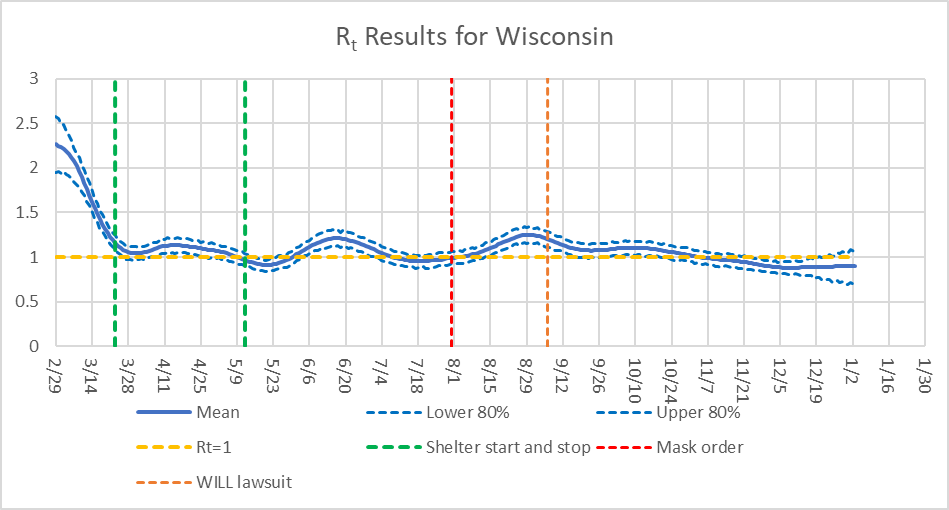
Rt Results for Wisconsin
What can we learn from the Wisconsin experience?
- The graphs are connected. Around November 4th, Rt dropped below 1. New cases peaked 10 days later, quickly followed by hospitalizations. A month after the Rt went below 1, deaths peaked and started falling.
- The moral is that if we want to reduce COVID-19 deaths or prevent overcrowded hospitals, we need to reduce the transmission rate.
- There is widespread disinformation about the disease, such as that it is benign, no worse than the flu and that masks do not work or are a danger to one’s health.
- Both nationally and on the state level, there is a very active pro-COVID-19 lobby, that fights any restrictions on activity and spreads disinformation.
- Nationally, this lobby is centered on President Donald Trump, who persists in minimizing the danger of COVID-19 and sponsoring super-spreader events. Trump is able to create his own world. More worrisome is that he is also able to convince a surprising number of people that Trump’s world is reality.
- Wisconsin also has members of the pro-COVID-19 lobby. Most prominent is the Wisconsin Institute for Law and Liberty (WILL) which has sued Governor Tony Evers over his most recent mask order. The Wisconsin Supreme Court is currently mulling what to do with the order, which is likely to have played a part in reducing the pandemic’s surge.
It is appropriate to celebrate Wisconsin’s progress in bringing down the incidence of COVID-19. Just don’t celebrate in a crowd without masks and social distancing. And, while celebrating, remember the 5,264 Wisconsinites who have lost their lives to the disease. So far.
Data Wonk
-
Who Do You Trust to Conduct Elections Fairly?
 Apr 6th, 2026 by Bruce Thompson
-
Is Non-Citizen Voting a Real Threat to Elections in Wisconsin?
Mar 18th, 2026 by Bruce Thompson
-
How Global Climate Change Affects Milwaukee
 Mar 11th, 2026 by Bruce Thompson