New Highs for COVID-19 Testing, Cases, Deaths
State reports over 10,000 tests in a single day for the first time.
Wisconsin set a number of COVID-19 milestones on Wednesday, some positive and others negative.
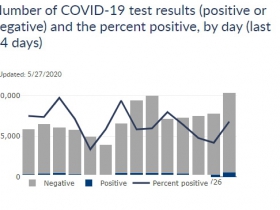
The Department of Health Services reported a new 24-hour testing high at 10,330 tests processed, beating the prior high of 9,976 set last week.
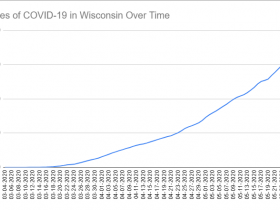
The state also set a one-day high for new cases at 599 boosting the state’s total to 16,462 over the length of the outbreak.
The testing total and number of new cases are correlated, but the percentage of tests that come back positive fluctuates. Public health officials are looking for it to trend downward as a sign that the disease’s spread is slowing.
The rate reported Wednesday was 5.80 percent, an increase over the seven-day and 14-day averages of 5.14 and 5.61 percent. The rate had decreased for four consecutive days prior to Wednesday’s total.
DHS reported 22 newly-confirmed deaths, a single-day high. But the single-day data point does not tell the whole story. Since April 1st an average of 9.18 deaths have been confirmed per day, but even with Wednesday’s figure the state has averaged only 8.29 deaths per day over the past week.
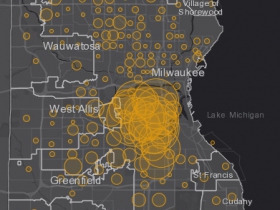
“We are certainly seeing an increase in hospitalizations, but not at all that hospitals are needing to use their surge plans,” said DHS Secretary-designee Andrea Palm during a media briefing Wednesday afternoon. She said DHS continues to monitor the hospitalization levels closely. Approximately half of the hospitalizations are in Milwaukee County.
Given the Supreme Court ruling that ended the state Safer-at-Home order two weeks ago, is that what’s driving the surge? “An epidemic is extremely complex and you can never say one thing caused another,” said Dr. Ryan Westergaard, Chief Medical Officer at the DHS Bureau of Communicable Diseases. He said one thing is certain and provides guidance on how people should act. “All 599 cases that were diagnosed today resulted from a person being in close contact with a person with the infection.”
Palm and Westergaard previously said that hospitalizations and deaths are lagging indicators often coming three to five weeks after an initial diagnosis.
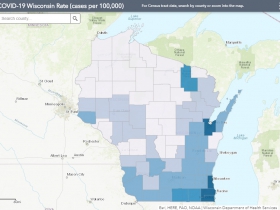
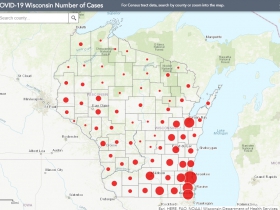
Both Brown and Racine counties continue to have greater per capita outbreaks than Milwaukee.
Brown County, which is anchored by Green Bay, has 879.6 cases per 100,000 residents (up from 865.7). Racine County has 808.1 cases per 100,000 residents (up from 713.9). Milwaukee County has 707.2 cases per 100,000 residents (up from 683).
Kenosha (613.7), Rock (363.5), Walworth (352.4), Forest (266.1), Dodge (189.1), Fond du Lac (180.1), Grant (171.7), Ozaukee (163.1), Kewaunee (162.1), Crawford (159.6), Washington (157.6) and Green (157.3) are the only other counties with more than 150 cases per 100,000 residents.
The statewide average of cases per 100,000 residents has risen to 284.9 (up from 274.5).
DHS reports 59 percent of people with positive cases have recovered, defined by a positive test over 30 days ago or a record of symptom abatement.
There are currently 955 ventilators and 398 intensive care unit (ICU) beds available across the state according to the Wisconsin Hospital Association. Since the data became publicly available on April 10th, WHA has reported an average of 934 ventilators and 420 ICU beds as available.
Charts and Maps
Wisconsin COVID-19 summary
| Status | Number (%) of People as of 5/27/2020 |
|---|---|
| Negative Test Results | 210,605 |
| Positive Test Results | 16,462 |
| Hospitalizations | 2,411 (15%) |
| Deaths | 539 |
Percent of COVID-19 cases by hospitalization status
| Hospitalization status | Number of confirmed cases as of 5/27/2020 | Percent of confirmed cases as of 5/27/2020 |
|---|---|---|
| Ever hospitalized | 2,411 | 15% |
| Never hospitalized | 9,035 | 55% |
| Unknown | 5,016 | 30% |
| Total | 16,462 | 100% |
Summary of COVID-19 cases by age group
| Age Group (Years) | Cases as of 5/27/2020 | Ever hospitalized as of 5/27/2020 | Any Intensive Care as of 5/27/2020 | Deaths as of 5/27/2020 |
|---|---|---|---|---|
| <10 | 398 | 14 | 1 | 0 |
| 10-19 | 1,002 | 33 | 3 | 0 |
| 20-29 | 2,866 | 114 | 18 | 5 |
| 30-39 | 2,956 | 174 | 28 | 7 |
| 40-49 | 2,772 | 280 | 64 | 16 |
| 50-59 | 2,603 | 424 | 102 | 46 |
| 60-69 | 1,857 | 520 | 152 | 86 |
| 70-79 | 1,023 | 446 | 107 | 141 |
| 80-89 | 662 | 298 | 54 | 138 |
| 90+ | 323 | 108 | 21 | 100 |
| Total | 16,462 | 2,411 | 550 | 539 |
Percent of COVID-19 cases and deaths by gender
| Gender | Confirmed Cases as of 5/27/2020 | Deaths as of 5/27/2020 |
|---|---|---|
| Female | 51% | 43% |
| Male | 49% | 57% |
| Unknown | 0% | 0% |
| Total Number | 16,462 | 539 |
Confirmed COVID-19 cases and deaths by race
| Race | Number of cases as of 5/27/2020 | Percent of cases as of 5/27/2020 | Number of deaths as of 5/27/2020 | Percent of deaths as of 5/27/2020 |
|---|---|---|---|---|
| American Indian | 186 | 1% | 9 | 2% |
| Asian or Pacific Islander | 618 | 4% | 14 | 3% |
| Black | 3,234 | 20% | 141 | 26% |
| White | 8,576 | 52% | 361 | 67% |
| Multiple or Other races | 2,092 | 13% | 2 | 0% |
| Unknown | 1,756 | 11% | 12 | 2% |
| Total | 16,462 | 100% | 539 | 100% |
Confirmed COVID-19 cases and deaths by ethnicity
| Ethnicity | Number of cases as of 5/27/2020 | Percent of cases as of 5/27/2020 | Number of deaths as of 5/27/2020 | Percent of deaths as of 5/27/2020 |
|---|---|---|---|---|
| Hispanic or Latino | 5,470 | 33% | 47 | 9% |
| Not Hispanic or Latino | 9,154 | 56% | 480 | 89% |
| Unknown | 1,838 | 11% | 12 | 2% |
| Total | 16,462 | 100% | 539 | 100% |
Number of positive cases and deaths by county
| Wisconsin County | Positive as of 5/27/2020 | Negative as of 5/27/2020 | Deaths as of 5/27/2020 | Rate (positive cases per 100,000 people) as of 5/27/2020 | Case fatality percentage (percent of cases who died) as of 5/27/2020 |
|---|---|---|---|---|---|
| Adams | 4 | 522 | 1 | 19.9 | 25% |
| Ashland | 2 | 368 | 0 | 12.7 | 0% |
| Barron | 14 | 1,560 | 0 | 30.9 | 0% |
| Bayfield | 3 | 376 | 1 | 20.0 | 33% |
| Brown | 2,285 | 12,570 | 33 | 879.6 | 1% |
| Buffalo | 5 | 595 | 1 | 38.0 | 20% |
| Burnett | 1 | 366 | 1 | 6.6 | 100% |
| Calumet | 74 | 1,583 | 1 | 148.6 | 1% |
| Chippewa | 54 | 2,380 | 0 | 84.9 | 0% |
| Clark | 29 | 788 | 4 | 84.1 | 14% |
| Columbia | 40 | 2,104 | 1 | 70.2 | 3% |
| Crawford | 26 | 861 | 0 | 159.6 | 0% |
| Dane | 652 | 26,786 | 27 | 123.1 | 4% |
| Dodge | 166 | 2,793 | 1 | 189.1 | 1% |
| Door | 38 | 1,166 | 3 | 138.5 | 8% |
| Douglas | 19 | 1,048 | 0 | 43.8 | 0% |
| Dunn | 24 | 1,861 | 0 | 53.9 | 0% |
| Eau Claire | 99 | 4,171 | 0 | 96.1 | 0% |
| Florence | 2 | 238 | 0 | 46.1 | 0% |
| Fond du Lac | 185 | 4,133 | 4 | 180.8 | 2% |
| Forest | 24 | 271 | 1 | 266.1 | 4% |
| Grant | 89 | 2,044 | 12 | 171.7 | 13% |
| Green | 58 | 1,207 | 0 | 157.3 | 0% |
| Green Lake | 16 | 749 | 0 | 85.3 | 0% |
| Iowa | 12 | 755 | 0 | 50.8 | 0% |
| Iron | 2 | 227 | 1 | 35.0 | 50% |
| Jackson | 14 | 1,028 | 1 | 68.3 | 7% |
| Jefferson | 92 | 2,506 | 3 | 108.7 | 3% |
| Juneau | 22 | 831 | 1 | 83.3 | 5% |
| Kenosha | 1,033 | 6,634 | 24 | 613.7 | 2% |
| Kewaunee | 33 | 626 | 1 | 162.1 | 3% |
| La Crosse | 51 | 4,700 | 0 | 43.3 | 0% |
| Lafayette | 25 | 479 | 0 | 149.4 | 0% |
| Langlade | 2 | 429 | 0 | 10.4 | 0% |
| Lincoln | 5 | 545 | 0 | 18.0 | 0% |
| Manitowoc | 32 | 2,045 | 1 | 40.3 | 3% |
| Marathon | 43 | 2,487 | 1 | 31.8 | 2% |
| Marinette | 32 | 2,252 | 2 | 78.9 | 6% |
| Marquette | 3 | 453 | 1 | 19.7 | 33% |
| Menominee | 3 | 768 | 0 | 65.5 | 0% |
| Milwaukee | 6,748 | 36,346 | 282 | 707.2 | 4% |
| Monroe | 16 | 2,239 | 1 | 35.2 | 6% |
| Oconto | 35 | 1,513 | 0 | 93.2 | 0% |
| Oneida | 8 | 1,063 | 0 | 22.6 | 0% |
| Outagamie | 198 | 6,762 | 8 | 107.2 | 4% |
| Ozaukee | 144 | 2,170 | 11 | 163.1 | 8% |
| Pepin | 1 | 354 | 0 | 13.8 | 0% |
| Pierce | 43 | 1,196 | 0 | 103.4 | 0% |
| Polk | 17 | 1,136 | 1 | 39.2 | 6% |
| Portage | 10 | 1,529 | 0 | 14.2 | 0% |
| Price | 2 | 308 | 0 | 14.8 | 0% |
| Racine | 1,579 | 9,348 | 28 | 808.1 | 2% |
| Richland | 14 | 585 | 4 | 79.8 | 29% |
| Rock | 588 | 7,611 | 18 | 363.5 | 3% |
| Rusk | 5 | 264 | 0 | 35.3 | 0% |
| Sauk | 78 | 3,057 | 3 | 122.6 | 4% |
| Sawyer | 7 | 941 | 0 | 42.8 | 0% |
| Shawano | 41 | 1,591 | 0 | 100.0 | 0% |
| Sheboygan | 83 | 2,576 | 3 | 72.0 | 4% |
| St. Croix | 71 | 2,472 | 0 | 80.8 | 0% |
| Taylor | 1 | 359 | 0 | 4.9 | 0% |
| Trempealeau | 22 | 1,273 | 0 | 74.7 | 0% |
| Vernon | 19 | 1,015 | 0 | 62.3 | 0% |
| Vilas | 6 | 424 | 0 | 27.8 | 0% |
| Walworth | 363 | 3,275 | 16 | 352.4 | 4% |
| Washburn | 2 | 514 | 0 | 12.7 | 0% |
| Washington | 212 | 3,412 | 4 | 157.6 | 2% |
| Waukesha | 593 | 9,658 | 28 | 148.7 | 5% |
| Waupaca | 27 | 2,029 | 1 | 52.5 | 4% |
| Waushara | 8 | 830 | 0 | 33.2 | 0% |
| Winnebago | 199 | 5,799 | 3 | 117.1 | 2% |
| Wood | 9 | 1,651 | 1 | 12.3 | 11% |
| Total | 16,462 | 210,605 | 539 | 284.9 | 3% |
If you think stories like this are important, become a member of Urban Milwaukee and help support real, independent journalism. Plus you get some cool added benefits.
More about the Coronavirus Pandemic
- Governors Tony Evers, JB Pritzker, Tim Walz, and Gretchen Whitmer Issue a Joint Statement Concerning Reports that Donald Trump Gave Russian Dictator Putin American COVID-19 Supplies - Gov. Tony Evers - Oct 11th, 2024
- MHD Release: Milwaukee Health Department Launches COVID-19 Wastewater Testing Dashboard - City of Milwaukee Health Department - Jan 23rd, 2024
- Milwaukee County Announces New Policies Related to COVID-19 Pandemic - David Crowley - May 9th, 2023
- DHS Details End of Emergency COVID-19 Response - Wisconsin Department of Health Services - Apr 26th, 2023
- Milwaukee Health Department Announces Upcoming Changes to COVID-19 Services - City of Milwaukee Health Department - Mar 17th, 2023
- Fitzgerald Applauds Passage of COVID-19 Origin Act - U.S. Rep. Scott Fitzgerald - Mar 10th, 2023
- DHS Expands Free COVID-19 Testing Program - Wisconsin Department of Health Services - Feb 10th, 2023
- MKE County: COVID-19 Hospitalizations Rising - Graham Kilmer - Jan 16th, 2023
- Not Enough Getting Bivalent Booster Shots, State Health Officials Warn - Gaby Vinick - Dec 26th, 2022
- Nearly All Wisconsinites Age 6 Months and Older Now Eligible for Updated COVID-19 Vaccine - Wisconsin Department of Health Services - Dec 15th, 2022
Read more about Coronavirus Pandemic here





What I would find to be helpful is knowing the active cases that will be an estimate for sure but would provide for people a feel for how many folks are out there and where they are would be helpful as well Not address but census track level of detail
Also to know how many folks that test positive know where they got it how many folks who test positive have no symptoms. I know of one group home where 36 were positive but only 6 had symptoms
@Thomas – On the active cases that view is not available (and the way the state tracks it is fairly imprecise by just classifying any case older than 30 days as recovered). You can get a sense locally by looking at the 14 and 7 day charts in the Milwaukee County COVID-19 Dashboard (linked in the article).
Your question about contact tracing (the source) is one that contact tracers are collecting data around, but I don’t believe is being specifically answered (you have a lot of correlation, but there isn’t a ruling of you specifically got it here). The election report is a good example of what type of data can be generated. There have been some cases (Fond du Lac County comes to mind) where a number of positive cases were traced back to a single party, but there are others where it could be from multiple places.
On the asymptomatic front that data would be challenging to collect and report because you can be asymptomatic for quite some time (up to 14 days) and then start showing symptoms. So you would need a large workforce checking in with known infections everyday to see if their symptoms have changed. In the case of someone I know they went on quite a rollercoaster ride where there were symptoms, then they were virtually gone, and then back again.