
A Report Card for Milwaukee Schools
State data shows charter and choice schools typically outperform traditional public schools.
Milwaukee Public Schools Office of School Administration, 5225 W. Vliet St. Photo courtesy of Milwaukee Public Schools.
Every year the Wisconsin Department of Public Instruction issues its “school report card.” These rate most schools in the state using a variety of school performance measures. Originally the report cards were limited to traditional public schools, under the direct control of school boards, and charter schools, which are independent public schools answerable to the chartering entities. In recent years, private schools that participated in Wisconsin’s “Choice” program, which pays some students’ tuition, were added to the report card.
The first graph shows enrollment totals for the three types of K-12 schools which accept public money, calculated from data in the school report cards. Of all the schools that accept public money, a bare majority (54 percent) of Milwaukee students attend schools that are administered as traditional public schools. Thirty two percent attend private schools that participate in the Milwaukee Parental Choice Program. The other 14% are in charter schools, public schools with their own independent administration (a small number of them are “instrumentality” charter schools which employ Milwaukee Public Schools teachers, but the state data does not separate them out.).
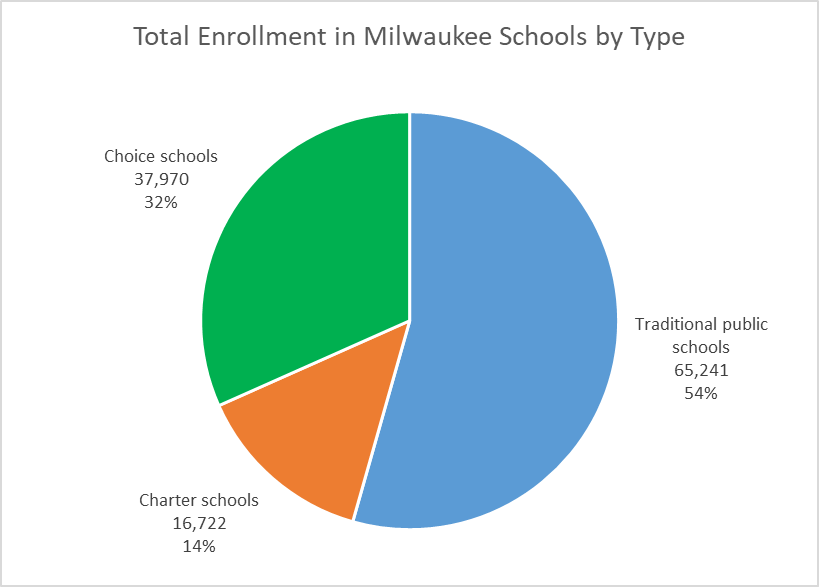
Total Enrollment in Milwaukee Schools by Type
Milwaukee’s student population is the most diverse in Wisconsin. The report cards show percentages of student enrollment for six ethnic groups (American Indian or Alaskan native, Asian, black or African American, Hispanic/Latino, native Hawaiian or other Pacific islander, white, and two or more races).
The next chart shows enrollment by the two largest ethnic groups–black and Hispanic students. I estimated these totals by multiplying each school’s student enrollment by its reported black and Hispanic percentage and adding up the numbers. It is safe to predict that these numbers are under-estimates. For example, in recent years, Wisconsin has allowed students to report two or more ethnicities, rather than forcing them to pick one.
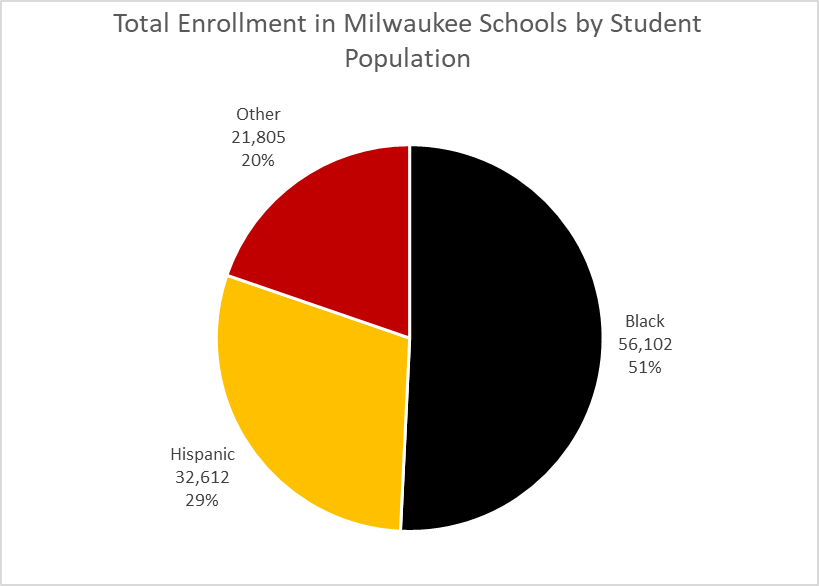
Total Enrollment in Milwaukee Schools by Student Population
Because of Milwaukee housing problems and other factors, a number of Milwaukee schools have become heavily Hispanic or heavily African American. The former are mainly on the South Side while the latter are in the north and northwest sides of the city. To better understand those patterns, I looked at three groups of Milwaukee schools: those whose student populations are at least 70 percent Hispanic, those at least 70 percent black, and the remaining schools that are neither.
The 70 Percent Hispanic Schools
The movement towards choice and charter schools has been particularly strong on the South Side. This is reflected in the chart below, showing that combined enrollment in charter schools and the choice program out number that in traditional public schools.
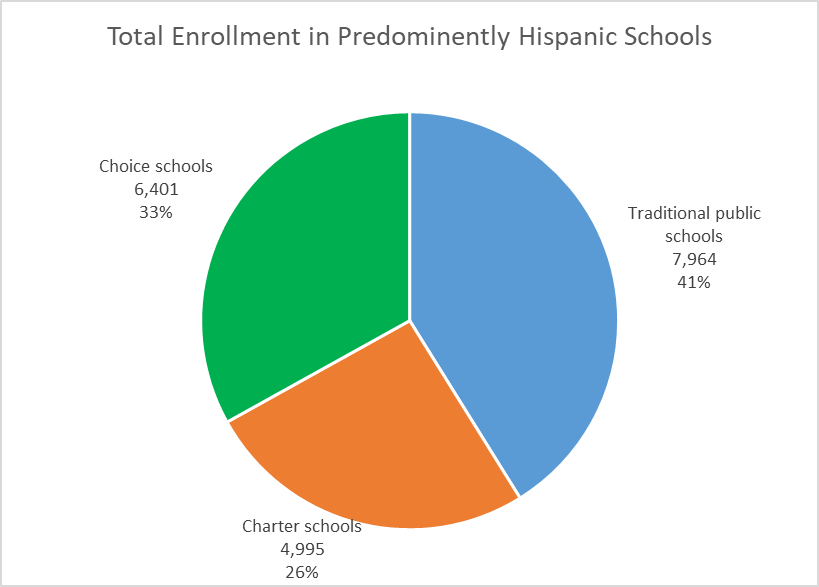
Total Enrollment in Predominantly Hispanic Schools
The next graph, called a “bubble chart”, shows the individual schools with 70 percent Hispanic enrollment. As in the chart above, traditional public schools are shown in blue, charter schools in rust, and choice schools in green. The horizontal axis shows the percentage of students who are Hispanic. The size of the bubble reflects school enrollment.
The vertical axis shows the Overall Accountability Score calculated by the Department of Public Instruction from each school’s data. These scores translate into Overall Accountability Ratings. Any score below 53 translates to “fails to meet expectations.” Between 53 and 63 results a rating of “meets few expectations,” between 63 and 73 is “meets expectations,” between 73 and 83 is “exceeds expectations,” and above 83 gives “significantly exceeds expectations.”
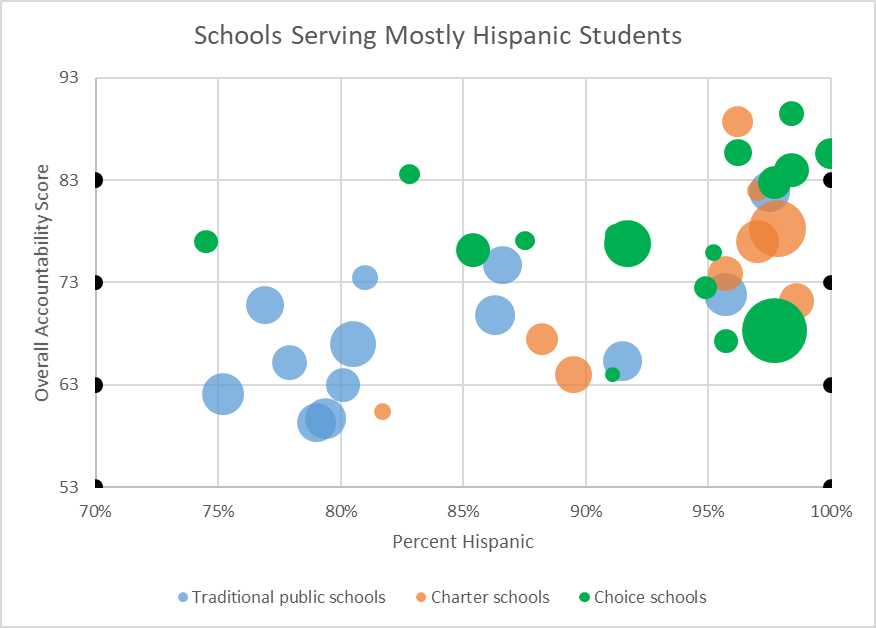
Schools Serving Mostly Hispanic Students
On average MPS traditional schools serving a predominantly Hispanic population are rated lower than the charter and choice schools serving a similar population. Several fall below the score of 63 required to get a “meets expectations” rating. The average score for the traditional schools is 67.9 (“meets expectations”), compared to 74.9 for the charter schools and 76.4 for schools in the choice program — a rating of “exceeds expectations” for both.
The 70 Percent African American Schools
Of the predominantly African American schools whose population is 70 percent black, half (49 percent) to the students attend traditional MPS. The other half is split between and choice schools (38 percent) and charter schools (13 percent).
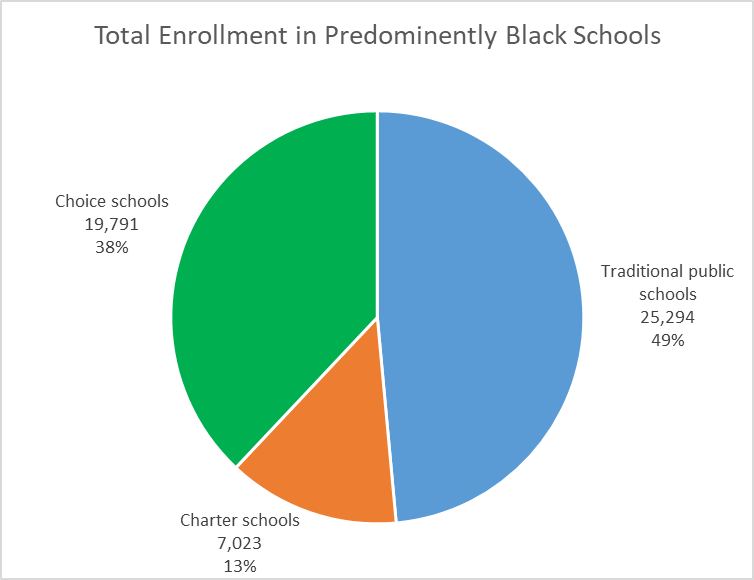
Total Enrollment in Predominantly Black Schools
The bubble chart for predominantly black schools shows that many are not doing well, particularly among the traditional MPS schools. In fact, compared to the data for the Hispanic schools, I had to extend the vertical axis downward, from 50 to 20 to accommodate all the schools “failing to meet expectations.
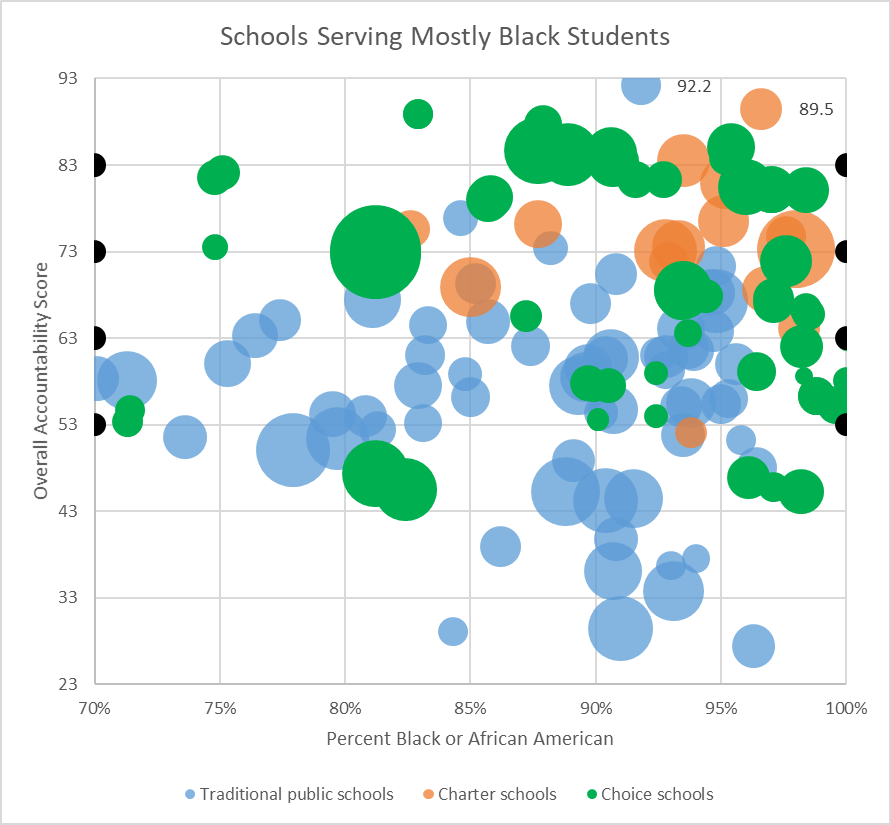
Schools Serving Mostly Black Students
Overall, the weighted performance score for MPS traditional schools is 54.9 (“meets few expectations”). For charter schools, it is 74.2 (“exceeds expectations”) and for choice schools it is 70.1 (“meets expectations”).
Milwaukee Excel, with a score of 89.5 (“significantly exceeds expectations”) is a charter school chartered by the Milwaukee School Board. Standing out even more is Marvin Pratt with a score of 92.2, a traditional MPS school.
Everyone else
Finally, the remaining 40 percent of Milwaukee students attend schools that are not overwhelmingly black or Hispanic. As the next chart shows, these students are much less likely to attend charter or choice schools than are the two previous groups.
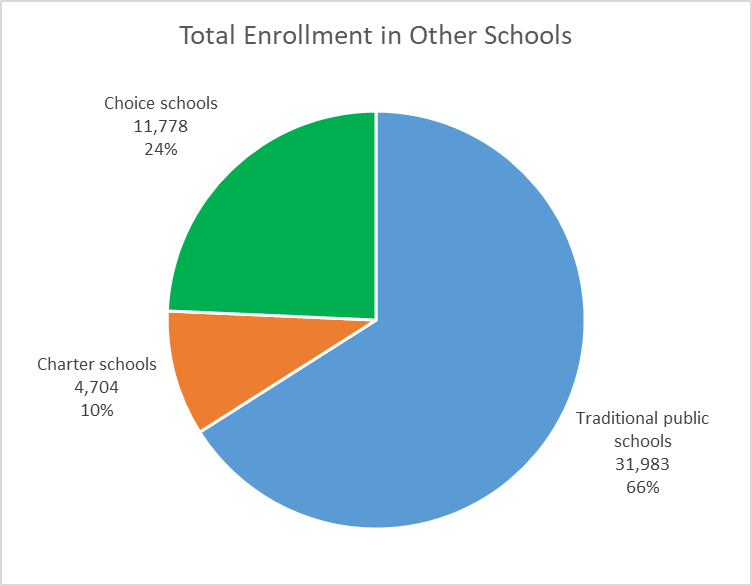
Total Enrollment in Other Schools
Again, for this population as a group, charter and choice schools (76.5 and 75.6 respectively — are both at the level of “exceeds expectations”) and outperform traditional MPS schools (65.4 — “meets expectations”). The large MPS high schools without admissions requirements particularly pull down the MPS average.
Lessons for Milwaukee Public Schools
What explains the poor performance of the MPS schools? Clearly there is no guarantee of superiority that comes from sending one’s child to a charter or choice school. Some traditional MPS schools outperform some charter and choice schools. Nevertheless, in aggregate, both Hispanic and African American children perform better in choice and charter schools than they do in traditional MPS schools. What might account for this difference?
One factor, I think, results from one of the legal restrictions on charter schools. No child can be assigned to a charter school. That means that every child at the school (or at least their parents) has chosen to go to that school. One hypothesis is that the act of choosing a school may indicate a level of involvement that may be absent in other students’ lives.
Another factor is the notion common among school board members that a good school should serve the needs of every student. Too often, the result is a school that doesn’t serve anyone very well.I served on the advisory committee that recommended the school board approve the Milwaukee Excellence Charter School. Both board members were opposed; one kept repeating that she would never send her own child there.
In its application for a charter, the Milwaukee Excellence Charter School requested a building in zip code 53206, widely described as the most stressed Milwaukee neighborhood. This would force the founders to think seriously how to meet the needs of kids living in that area. After just a few years of operation Milwaukee Excellence Charter School is one of the most highly ranked in the city.
In looking through the MPS schools rated “not meeting expectations,” I am struck by how many would have been considered most successful 20 years ago. I think part of the explanation is that the student population changed over those years, but the school did not rethink what that population needed.
But so long as MPS schools continue to ignore the evidence of success by choice and charter schools, it is likely they will continue to lose students to those schools.
Data Wonk
-
Who Do You Trust to Conduct Elections Fairly?
 Apr 6th, 2026 by Bruce Thompson
-
Is Non-Citizen Voting a Real Threat to Elections in Wisconsin?
Mar 18th, 2026 by Bruce Thompson
-
How Global Climate Change Affects Milwaukee
 Mar 11th, 2026 by Bruce Thompson


Wow this is a very well written and thought out article. This should force us to increase school choice in milwaukee to help improve the achievement gap by those who are less fortunate in our community.
No, increasing school choice is not the solution to poor performance of some schools.
“Parental involvement” is the key factor. Parents involved with their children are likely to take the steps necessary to send their children to “quality” schools– public or private. By default neglected children end up in the nearest public school. With no parental involvement, truancy is rampant.– negatively affecting the education of the truant and the remainder of the class.
Too many children are raised by mothers and grandmothers overwhelmed by poverty. Where are the fathers? Too many males know how to make babies, but they fail to take responsibility for their upbringing. The tragic death of the jailed prisoner who had fathered five children– all with different mothers– is but one example of many. In addition, incarcerated males removes the father from the family making it difficult for the remaining provider to be involved with the child’s education. Poverty, agressive (but unfair) incarceration, unemployment, and bigotry perpetuates additional spreading of poverty and poor parenting.
Don’t blame public schools for lack of parental involvement and poor parenting.
We spend billions for baseball, football, basketball facilities– worse yet we spend billions (trillions) for never ending wars–
but as a society we continue to ignore the effects of racial discrimination and resultant poverty— which fosters poor parenting and neglected education. We can’t afford “wasteful” spending!– so the cycle continues.
Because we don’t know the mix of low income and special education in choice and charter schools, it is not fair to compare aggregated scores by school. Only a carefully matched sample of students that have been followed for a number of years from each school sector can give us truly accurate results. Choice school and charter school students frequently drop out in the middle of the year and transfer to public schools. Also, the article does not mention the closing down of some disastrous choice schools, whose students again end up in MPS.
Edward and velez are both correct. The choice and charter schools don’t have to take everyone and can toss out anyone who is a problem. The only valid comparison is to also have data that includes the parent’s education level, parent’s income level and whether or not the child comes from a single parent family. (My wife worked for MPS for 30+ years, 40+ different schools, as a Speech and Language Pathologist as both a regular and a sub.)
Charter organizations like Milwaukee College Prep and Carmen have had some significant success with some of their schools and have struggled with some schools they have started or taken over with results not very different from the MPS schools nearby. The mainstream media including the Journal/Sentinel choose not to give significant coverage to failing choice schools or investigate just who is making the major decisions about this program. It is program where Republican operatives make all of the major decisions while the religious entities that run most of these schools say nothing.
The comments here are a mix of good points, non sequiturs and delay tactics. One thing that would immediately shed more light is an analysis of charter school data broken down by authorizing agency (MPS, Milwaukee Common Council and UW- Milwaukee). The public deserves clarity on this, and the authorizing agencies should be held accountable for the power they have been given. Given the current composition of the MPS school board and their well known opposition to charter schools, this information would be particularly useful in decisions related to the April referendum on additional MPS funding.