Measuring Poverty’s Impact in the City
Powerful new data has been done. But some research was shut down.

Looking west from the roof of Milwaukee City Hall. Photo by Dave Reid.
Using Internal Revenue Service data, the economist Raj Chetty and his colleagues have developed an “opportunity index“ of the United States. Whether children enjoy upward mobility, they find, is heavily influenced by the neighborhood they grow up in.
Using Census Bureau and income tax data, they constructed a sample of 20.5 million Americans who were born between 1978-1983, making them in their mid-thirties in 2015. They mapped these individuals back to the Census tracts where they lived through age 23. Then, for each of the 70,000 tracts in America, Chetty and his colleagues estimated the individuals’ outcomes across a range of measures.
About half of these measures were economic, such as the household income. In addition, incarceration rate, teenage birth rate for women, high school graduation rate, and the percent who married were measured.In the 1990s, the federal government funded an experiment, called “Moving to Opportunity,” in which families living in public housing were randomly selected to move to safer neighborhoods. These families’ outcomes were compared to those of a similar control group. At the end of the study, researchers concluded that test scores among the children didn’t rise and the families didn’t benefit financially.
Chetty’s reanalysis of the data from the earlier study, however, found that moving to a better neighborhood did have an effect. However, rather than improving outcomes for the family itself, outcomes improved for the families’ children. In addition, the improvement was greater the longer the children lived in the better neighborhood. Thus, the youngest children showed the greatest effect.
What does the Chetty data show about Milwaukee? The map below shows the average household income of children of low-income parents who grew up in Milwaukee neighborhoods and several close-in suburbs. The Census tracts are color-coded based on the average household income of adults who were children in each tract. As mid-30s adults, those who were children in the darkest red tracts had average yearly household income under $10,000; those from the darkest blue had an income exceeding $50,000.
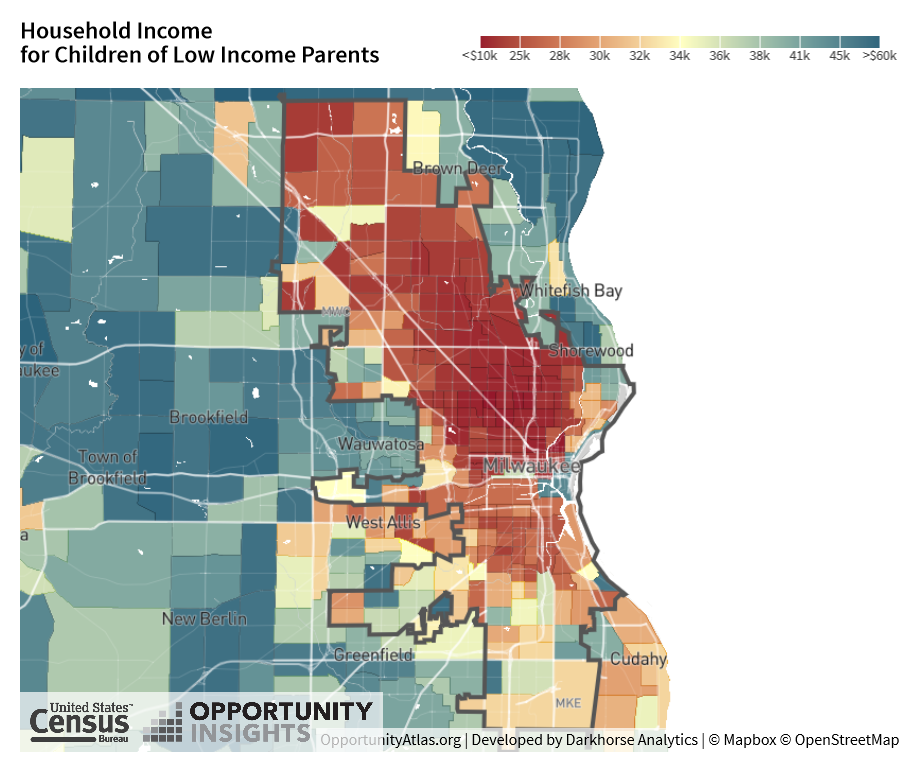
Household Income for Children of Low Income Parents
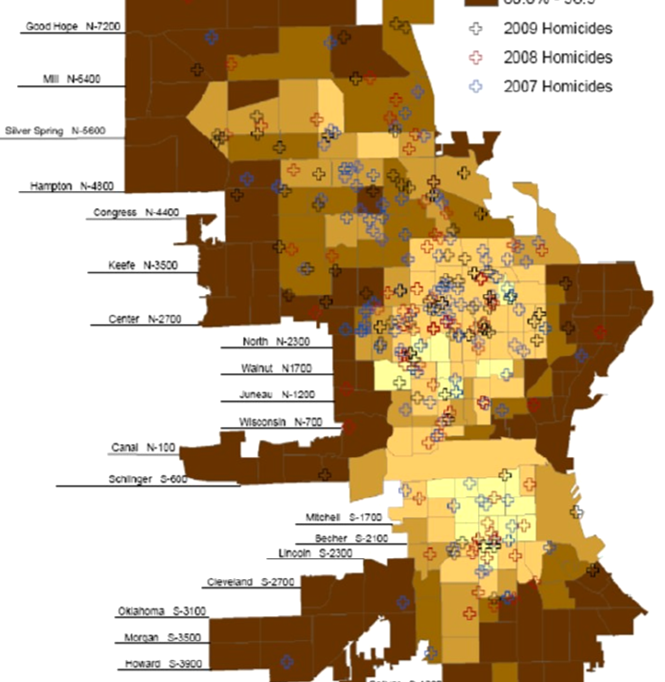
The fact that children growing up poor in central Milwaukee have poor outcomes is consistent with other indicators. The next chart is taken from the 2009 Homicides and Nonfatal Shootings Data Report from the Milwaukee Homicide Commission. This is the commission’s earliest report. People born in 1983 would have turned 23 in 2006. Thus, they would have been close in age to the youngest subjects in the Chetty sample.
This map shows two measures: the percentage of adults 25 or older who are high school graduates and the location of homicides between 2007 and 2009. Tracts with an 80 percent or higher rate of high school graduation are shown in dark brown; in the lightest tracts, fewer than half of residents graduated from high school. The locations of homicides are indicated with crosses.
Homicide locations
The next chart, also taken from the 2009 homicide report, shows the hotspots for homicides. Again, Census tracts that Chetty found associated with poor mobility had concentrations of violent crime.

Homicides hotspots
Milwaukee’s most vulnerable children are black boys. The next map shows the association between family income for black male adults and the various Milwaukee and suburban neighborhoods where they were children.
This map reflects the racial segregation the Milwaukee metropolitan area still suffers from. With two notable exceptions—Brown Deer and Glendale—the number of low-income black children fell below the minimum of 20 to be counted in most suburbs.
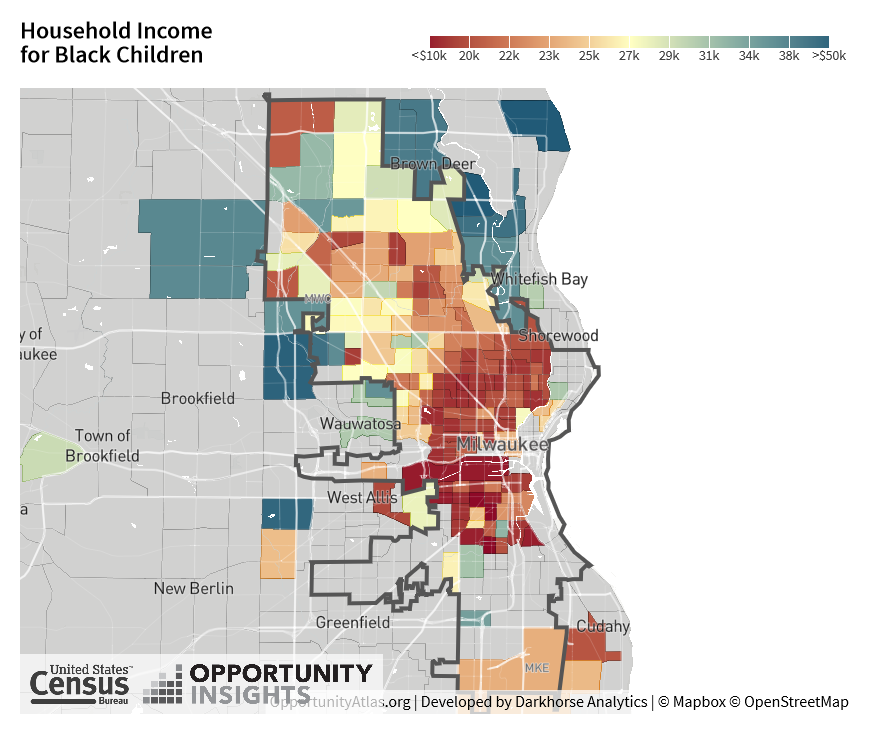
Household Income for Black Children
Whatever is causing the poor outcomes for black children in many of these neighborhoods has a stronger effect on boys than girls. Similar maps for boys have more red tracts and fewer blue ones than maps for girls.
The next map shows the result for Hispanic children. There much more variation of outcomes, perhaps reflecting both the greater geographical scatter, with pockets of Hispanic families dispersed about the region. Some adjacent tracts have very different outcomes.
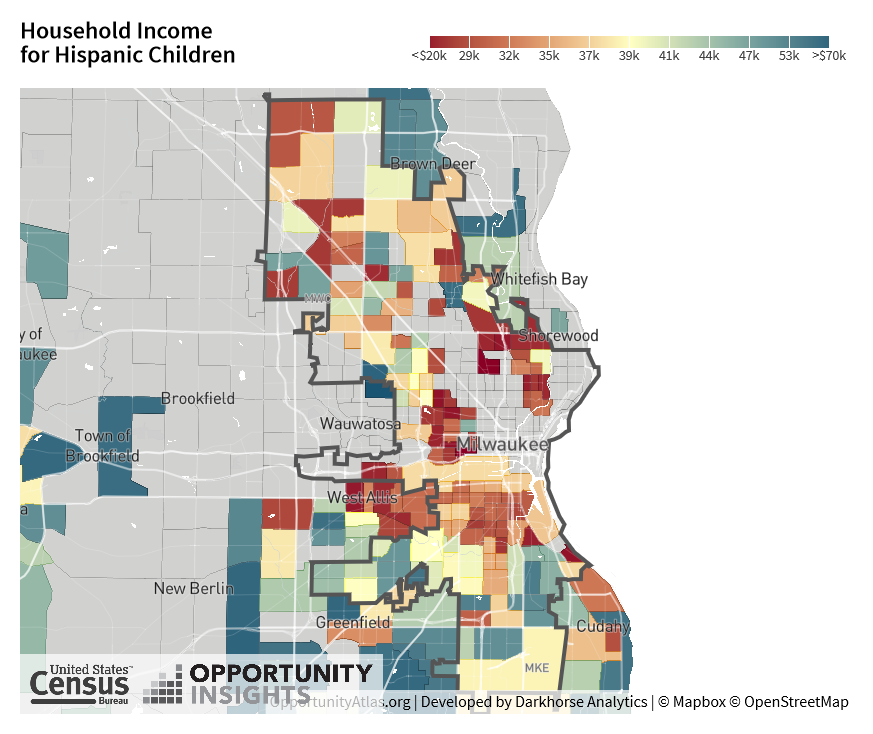
Household Income for Hispanic Children
The challenge in using the Chetty data, as with most data that appear to offer correlations, is sorting out cause and effect. For example, is there something about living in Brown Deer or Glendale that contributed to the success of those suburbs’ black children? Or does the ability of those children’s families to move to those suburbs reflect something about their families’ strength, a strength that was not reflected in their reported incomes?
According to an Atlantic magazine article, Charlotte, like Milwaukee a city with a low rate of upward mobility, has a number of programs aimed at testing what changes can strengthen its neighborhoods. Could Milwaukee do the same? There are some reasons for pessimism.
According to the Milwaukee Police Department, it offers the public data on crime at its Compass website. Yet its link to Compass generates an error.
Likewise, the Milwaukee Homicide Commission published annual and semi-annual reports over a period of years. Yet in 2016, these reports abruptly ceased. According to the Journal Sentinel database of Milwaukee homicides, after peaking in 2015, homicides declined. The scary thing is that no one seems to know why.
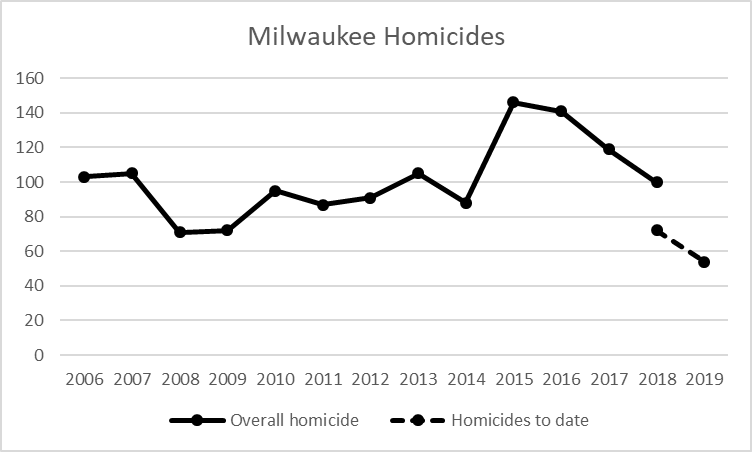
Milwaukee Homicides
Children growing up in many of Milwaukee’s poor neighborhoods often suffer from the ongoing stress of shootings, evictions, and other traumatic events. A culture that encourages research into the causes of these is a crucial element in finding ways to reverse them. It would be good news if organizations aimed at turning around Milwaukee looked hard at what it would take to enhance the effectiveness of Milwaukee neighborhoods. But the apparent demise of the Milwaukee Homicide Commission and its Homicides and Nonfatal Shootings Data Report sends a negative signal about the city’s interest in data-driven solutions to urban poverty.
Data Wonk
-
Who Do You Trust to Conduct Elections Fairly?
 Apr 6th, 2026 by Bruce Thompson
-
Is Non-Citizen Voting a Real Threat to Elections in Wisconsin?
Mar 18th, 2026 by Bruce Thompson
-
How Global Climate Change Affects Milwaukee
 Mar 11th, 2026 by Bruce Thompson