
We’re Not In Wisconsin Anymore
Climate change could make us more like Kansas, climate change projections show.
Illustration by Kristian Knutsen, Hayley Sperling and Will Cushman; image via Boston Public Library (CC BY 2.0)
By the time children born in the 2010s reach retirement age, many Wisconsin communities may feel something like late-20th-century Kansas City or Philadelphia, at least in terms of seasonal temperatures and precipitation.
That’s the forecast of scientists who, using statistical models, have developed “climatic analogs,” which attempt to provide more concrete answers to an abstract question: What would a 3 °C rise in mean global temperatures by the 2080s actually look and feel like in cities across North America?
An article published Feb. 12, 2019, in the journal Nature Communications provides a sneak peek of that potential climatic future, which infers that greenhouse gas emissions will remain near present levels.
Using a new statistical measure called a sigma dissimilarity, researchers at the University of Maryland and North Carolina State University have built an interactive online mapping tool that allows people to explore possible climate scenarios for more than 500 urban areas in the United States and Canada.
The tool is the latest in a series of climatic analog studies that researchers hope can help bridge a gap between abstract projections of global climate change and a more intuitive understanding of potential local impacts of those forecasts.
“The idea behind these types of studies is forecasting by analogy,” said Matt Fitzpatrick, an associate professor and ecologist at the University of Maryland Center for Environmental Science who co-authored the study.
Analogy forecasts are meant to help address a common shortfall in climate change communication, Fitzpatrick said. Scientists often talk about changing conditions in broad strokes, like long-term changes in global mean temperatures or global precipitation.
“There are a couple problems with that,” Fitzpatrick said. “Global changes don’t mean a lot in any given place, and the changes are small compared to the daily variability of weather. The idea behind this is to translate the projections into something that is more meaningful and local.”
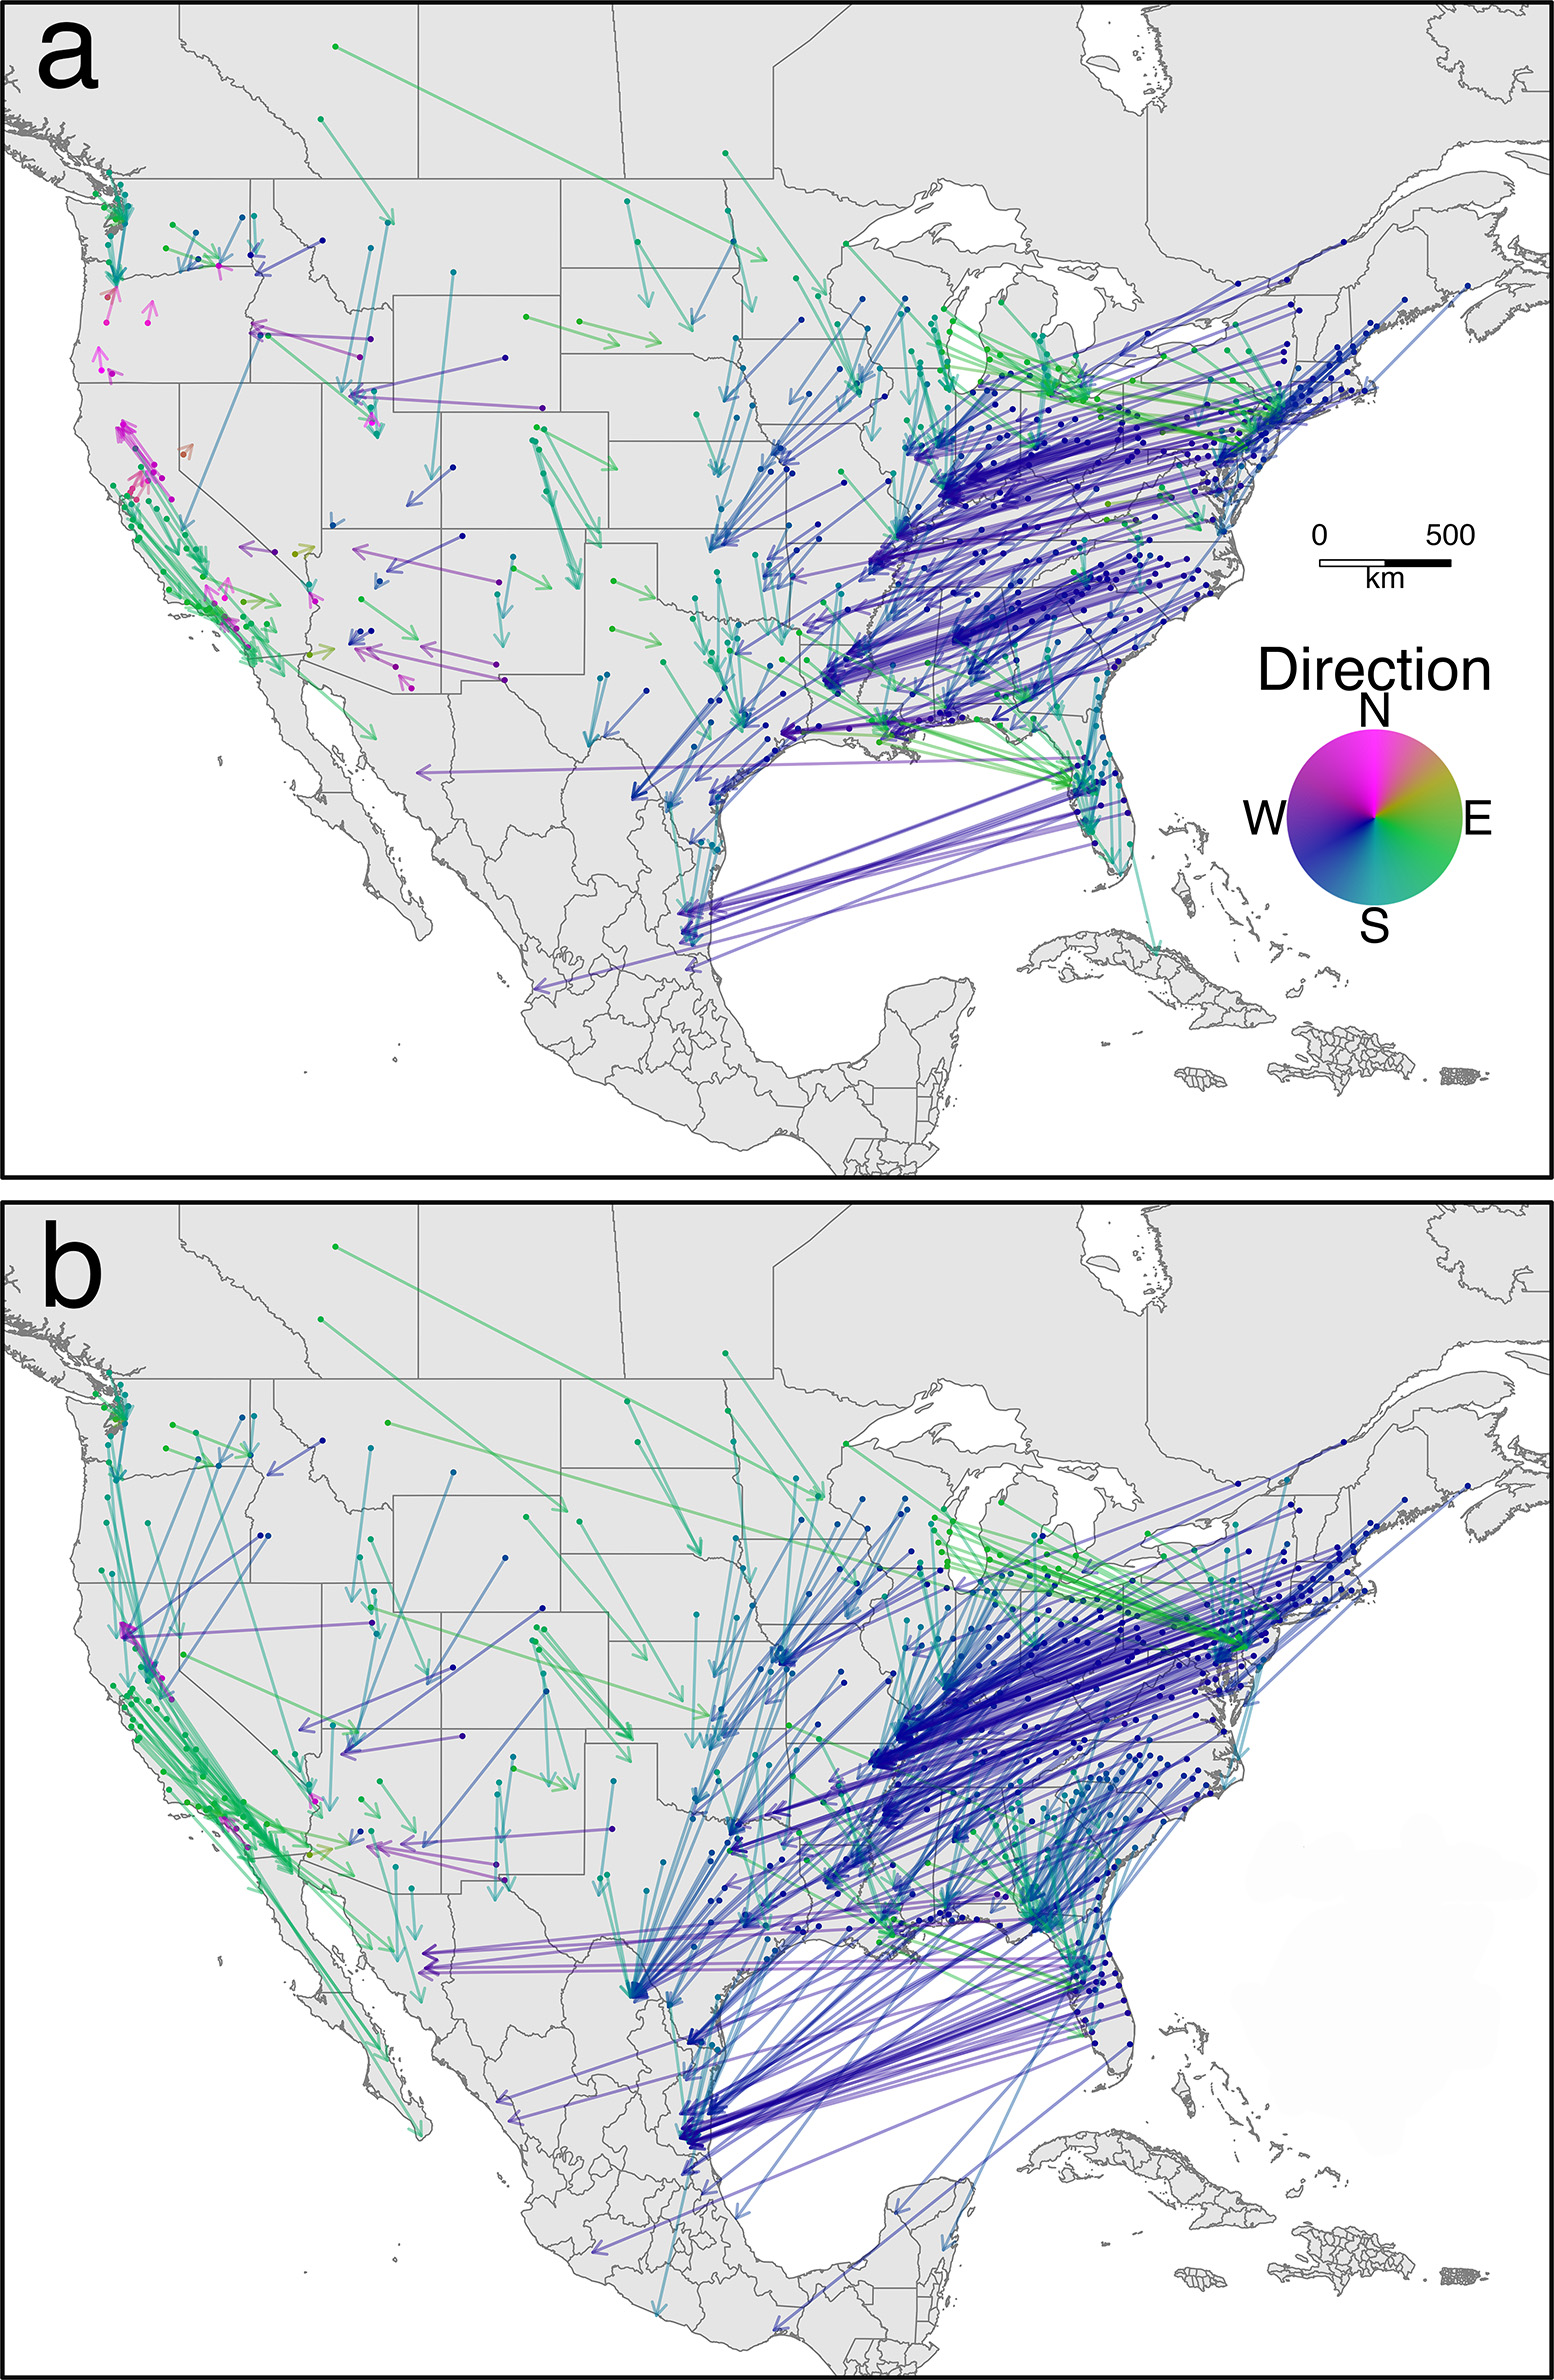
Arrows point from each urban area to the location of its projected climatic analog in the 2080s. Map a highlights the projections for lowered emissions, while map b highlights those for unmitigated emissions. Maps from the University of Maryland Center for Environmental Science.
To do that, Fitzpatrick and his collaborator Rob Dunn compared dozens of future climate scenarios for 540 North American communities with the late-20th-century conditions of locations across the northern half of the Western Hemisphere. In all, they compared 12 dimensions of climate, including seasonal minimum and maximum temperatures and precipitation.
Because climate is so multidimensional, drawing comparisons between the climates of any two times and places requires robust statistical methods, Fitzpatrick said. That’s what the sigma dissimilarity measure, developed in 2017, accomplishes.
“When you’re measuring the similarity between any two things, and you add more and more dimensions [for comparison], there are more and more ways that things can be different,” said Fitzpatrick. “The innovation here is boiling those dimensions down to a single number, which gives you an estimate of how extreme the difference is.”
In this approach, when comparing the climate forecast for one location, say Wausau, to the 1960 to 1990 mean local climates of other places in North America, a smaller number translates to the closer climate match.
In Wausau’s case, that closest match to its forecasted 2080s climate is the southern Iowa city of Ottumwa. Madison’s 2080s climate is forecast to be most similar to the Kansas City suburb of Lansing, Kansas, and Milwaukee is forecast to feel like Chester, Pennsylvania, located just south of Philadelphia.
These projections are broadly in line with the general trend projected for the eastern U.S., which forecasts northern cities experiencing warmer climates, with hotter and more humid summers, and winters with less snow.
“The Upper Midwest generally follows that trend, but not as strongly as some of the cities closer to the East Coast,” Fitzpatrick said.
Additionally, the mapping tool shows how communities’ climate analogs could change under a scenario where greenhouse gas emissions are reduced roughly to the levels that nations committed to under the 2015 Paris Agreement. Under that scenario, Wisconsin communities could expect climates more similar to northern Illinois, Iowa and Ohio.
In 2017, President Donald Trump announced that he would formally withdraw the U.S. from the Paris Agreement, though that withdrawal cannot take effect until 2020, and the Trump administration has proposed maintaining funding for the United Nations body overseeing the accord in its 2020 budget proposal.
The new climatic analog study is similar to a 2012 project of the Wisconsin Initiative on Climate Change Impacts led by University of Wisconsin-Madison geography professor Jack Williams, who has collaborated with Fitzpatrick on other studies.
Williams said work like this can help individuals and local communities address a number of long-term planning questions: from deciding what types of trees to plant in parks and yards to preparing for the potential impact of agricultural pests as they move northward.
“These maps are very accessible,” Williams said. “So, they’re pretty empowering for people.”
The Wisconsin project also produced an interactive mapping tool that allows users to compare the forecasted climate for any location in Wisconsin with contemporary climates elsewhere in North America. Fitzpatrick’s tool, though, is based on more current climate projections and statistical methods than the Wisconsin-focused tool.
While noting the newer study is built on updated data and statistical methods, Williams said he was pleased to see the projections are relatively in line with one another.
“To me, what this says is that it’s great that these methods are improving, but it also suggests that our findings are pretty stable,” Williams said. “I think this means we have a pretty good understanding of what the climates might look like over the coming decades.”
I Don’t Think We’re In Wisconsin Anymore was originally published on WisContext which produced the article in a partnership between Wisconsin Public Radio and Wisconsin Public Television.