A Data Portrait of the Walker Years
A huge success! — according to the MacIver Institute. Ah, not exactly.
Scott Walker. Photo by Jeramey Jannene.
The conservative MacIver Institute posts an Economic Scoreboard which compares 2011 figures with those for 2018 (actually mostly for 2017) on nine measures: the unemployment rate, economic growth, median per capita income, median household income, poverty rate, state and local tax burden, net migration, FoodShare enrollment, small businesses, and startup companies. The clear aim is to prove the success of Walker’s policies. “2011 column is to be considered the beginning of Gov. Scott Walker’s term, and 2018 the end. … As Gov. Evers goes into his first term, we will add a new column to track success under his administration when data becomes available.”
This column will look at some of this data, including one revealing category they left out: job growth. If one issue accounts for Walker’s election as governor, it was his promise to add 250,000 private sector jobs in his first term if elected. Instead of four years, it took him almost eight years to reach that goal. Between December of 2010 and December of 2018, private sector jobs in Wisconsin increased by about 270,000.
Nationally, and globally, the 2011 to 2018 period was marked by slow but steady growth as the world recovered from the Great Recession. Thus, it would be surprising if Wisconsin did not share this growth.
The trickier question is what role, if any, did Walker’s policies play in either retarding or enhancing this growth. One way to measure this is to compare Wisconsin’s performance with that of similar states. The next chart shows job growth for Wisconsin and the other Great Lakes states. Like Wisconsin these states have economies heavily dependent on manufacturing and agriculture.
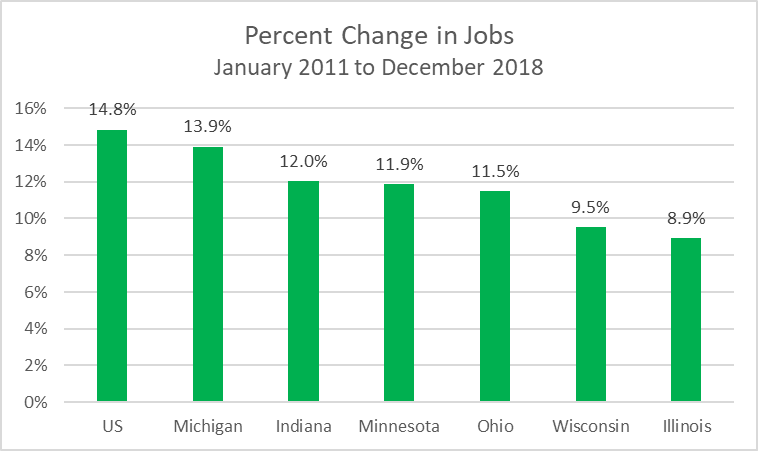
Percent Change in Jobs January 2011 to December 2018
Wisconsin’s job growth in the Walker period lagged that of most of its neighbors; only Illinois did worse. Illinois’ struggle is widely blamed on its unwillingness to adequately fund its pension obligations.
Another way to separate state policy from the overall economic environment is to build a model that predicts Wisconsin jobs in the pre-Walker era and then apply that model to the Walker period. The next graph shows a model that predicts Wisconsin jobs using the jobs in neighboring states (Illinois, Michigan, Ohio, Indiana, Minnesota, and Iowa). The prediction, shown in yellow is based on jobs between 1990 and 2010.
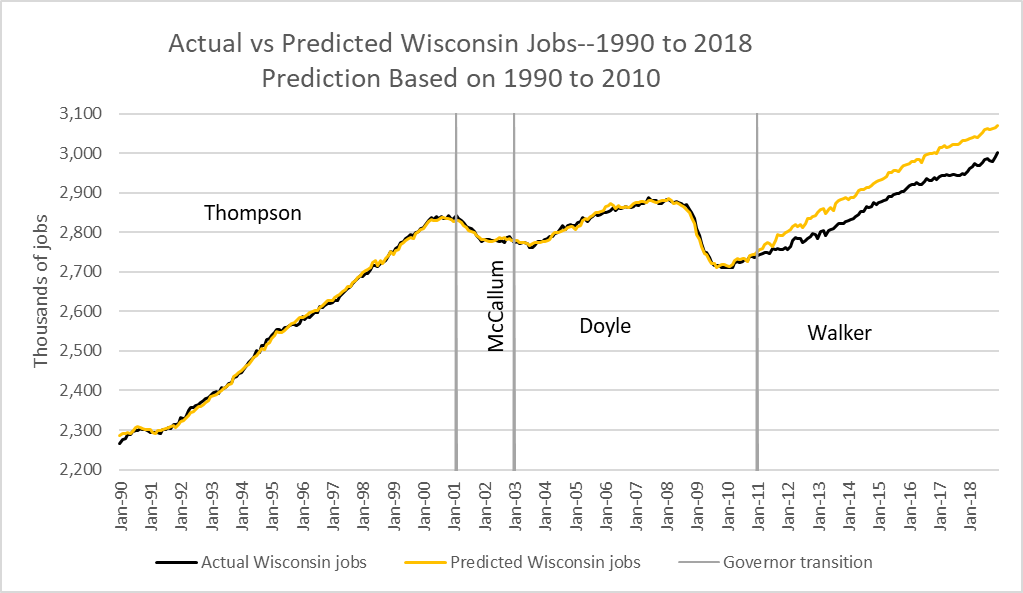
Actual vs Predicted Wisconsin Jobs–1990 to 2018. Prediction Based on 1990 to 2010
Between 1990 and 2010, the model predictions fit the actual Wisconsin jobs (shown in black) remarkably well. Once Walker assumes office, however, the model over-predicts the actual jobs. By 2018 the gap has widened to 60,000 to 80,000 jobs. Under Walker the state had a deficit of more than 900 jobs added per month for the 96 months he served as governor, compared to what job growth should have occurred if the state continued as it had from 1990 to 2011.
For each of its measures, the MacIver Scorecard compares a 2018 (or earlier) statistic to that for 2011. In most cases these numbers have gotten better — but this tell us little or nothing about the effectiveness of Walker’s policies. This was, after all, a period of steady recovery from the Great Recession. Absent some catastrophe, we would expect a state to show better numbers at the end of the period than at the beginning.
The approach taken by the MacIver Institute closely follows that of Walker himself. He would, for instance, compare the number of Wisconsin jobs in the most recent survey with that for the month he entered office—or even for the worst month of the recession, about a year before his inauguration—and take credit for the whole improvement.Take gross domestic product as an example. MacIver compares a Wisconsin GDP growth of 1.3 percent in 2011 to 2.7 percent in the second quarter of 2018. This seems like a great improvement until one checks the source of these numbers (from the Bureau of Economic Analysis) and discovers that 2.7 percent in that quarter puts Wisconsin at 48th among the states.
Rather than taking a single quarter it is more meaningful to consider GDP growth over the full 8 years Walker was governor. The chart below shows the percentages growth in real GDP between the 4th quarter of 2010 and the 2nd of 2018. Wisconsin’s GDP has grown about the same as its neighbors, but well behind the average for the nation. Over this period, Wisconsin’s GDP growth ranked 31st among all the states. (As of this writing, the Bureau of Economic Analysis had not yet released estimates for the last two quarters of 2018.)

Percent Change in GDP Since 2010 (Q4)
Another two measures used in the Scorecard are median per capita income and median household income. Both show increases—not surprising given the nation’s economic recovery and the fact that neither is adjusted for inflation.
The next graph shows average hourly wages over the last decade for Wisconsin, midwestern states and Wisconsin based on surveys from the Bureau of Labor Statistics. Despite the jumpiness of the state data, probably reflecting sample size, the relative positions of the states are quite stable. In short, Wisconsin didn’t do better compared to the nation or surrounding states under Walker. It seems likely that a state’s job mix has more effect on pay that anything the state government does.
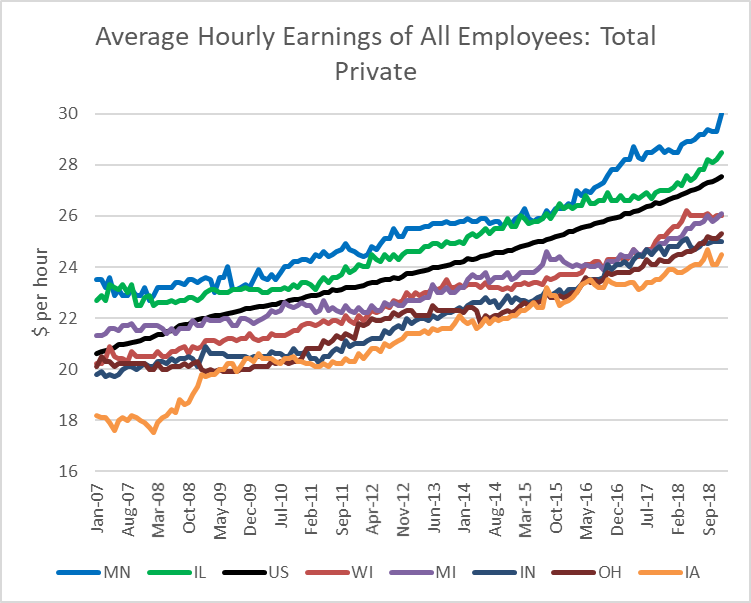
Average Hourly Earnings of All Employees: Total Private
Given the ongoing economic recovery, you’d expect the Wisconsin poverty rate is lower today than eight years ago. The next graph shows the performance of the US and Wisconsin poverty rates over time. Historically, Wisconsin has enjoyed a lower rate of poverty than nationally and while that continued under Walker, it may be concerning that Wisconsin’s advantage over the US has narrowed over the last four years.
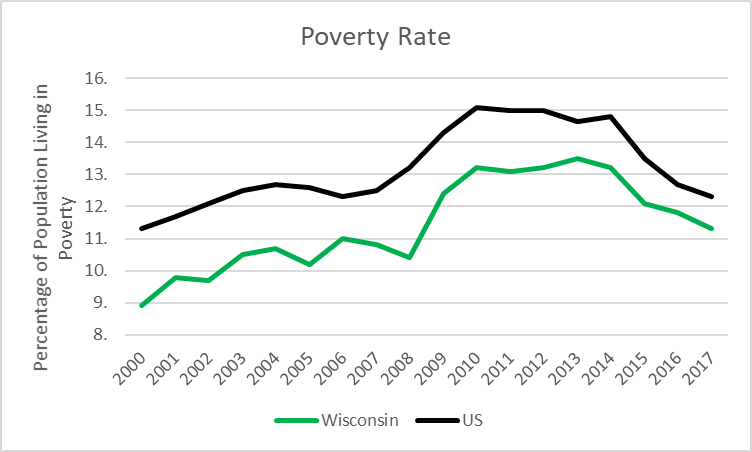
Poverty Rate
Another measure—and the last one examined here — is the state and local tax burden. Referencing the Wisconsin Policy Forum, the Scorecard compares a burden of 11.7 percent in 2011 to 10.5 percent today. However, the Forum attributes the decline much more to increased personal income than to reduced taxes: “The total tax burden shrank in recent years not because overall tax collections are lower than in previous years, but because incomes have continued to grow at a faster rate. State and local tax collections rose 2.3% in fiscal year 2018 … The tax burden dropped mainly because total personal income grew more quickly, at 3.6%.”
Wisconsin’s tax system is less regressive than most states, but it is still regressive particularly when it comes to wealthy people. The following graph is based on estimates from the Institute on Taxation & Economic Policy’s October 2018 report: Who Pays? A Distributional Analysis of the Tax Systems in All 50 States, 6th Edition. Wisconsin was rated as 34th most unfair, relatively good compared to most of its neighbors. Still there are substantial opportunities for additional revenue from people in the top fifth of taxpayers.
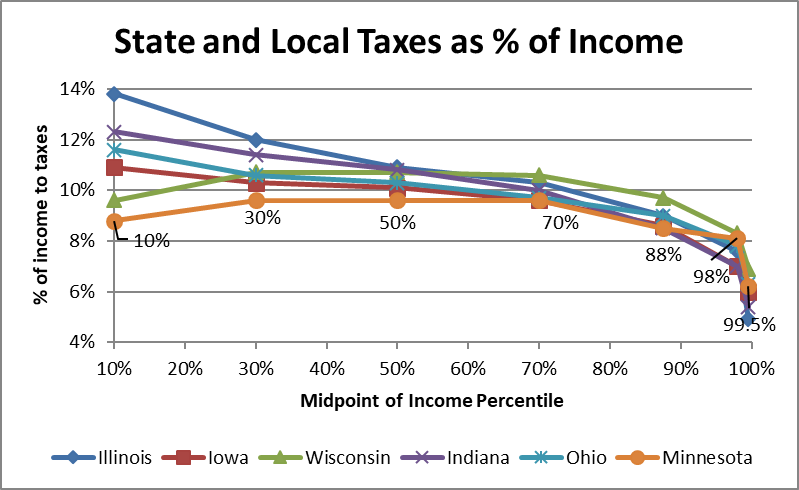
State and Local Taxes as % of Income
While the MacIver Foundation promotes itself as “the free market voice for Wisconsin,” in actuality it has given up serious economic analysis in favor of acting as a source of Republican-oriented propaganda.
Data Wonk
-
Who Do You Trust to Conduct Elections Fairly?
 Apr 6th, 2026 by Bruce Thompson
-
Is Non-Citizen Voting a Real Threat to Elections in Wisconsin?
Mar 18th, 2026 by Bruce Thompson
-
How Global Climate Change Affects Milwaukee
 Mar 11th, 2026 by Bruce Thompson