
Three Whopping Data Lies
Or how Walker, Schimel, Trump jump from correlation to causality.
Scott Walker, Brad Schimel and Donald Trump.
In trying to adjust to the realization that America has a president who regards lying as a standard business practice—claiming that his predecessor bugged his building, that there was massive voter fraud, and that his predecessor was not born in the US—it is easy to miss that there is a much more widespread way to mislead with data. A mantra in every statistics class is that “correlation does not prove causality.” Just because two things are related does not mean that one causes the other.
It is often easy to forget this, especially when the correlation seems to support one’s ideological position. Here are three recent examples of people making the convenient slide from correlation to causality, including Governor Scott Walker’s attempts to show that his policies created jobs and Wisconsin Attorney General Brad Schimel’s argument that the Wisconsin gerrymander results from demographic changes. Of course, no discussion of political misleading claims would be complete without President Donald Trump.
Walker’s Jobs Claim
Right from the start of his term, Gov. Walker has eagerly claimed credit for Wisconsin job growth. Among the claims he made in a May Journal Sentinel Op Ed was that “Wisconsin reached an all-time high for total employment with more than 3 million people working.” True, but irrelevant: the same could be said about most every state.
A few days before the release of the US jobs report, the New York Times published an Op Ed in which Walker took credit for improvements in Wisconsin:
…today the budget is balanced, taxes are down and more people in the state are working than ever.
A similar theme appears in his latest budget address:
During the past year, more people were employed in Wisconsin than ever before. The monthly average number of people employed in Wisconsin in 2016 was 2,998,889, higher than at any point since 1976 (when this statistic began being recorded).
The immediate problem with Walker’s taking credit for job growth is that Wisconsin has lagged behind other states, including most of our neighbors. The next chart shows the ratio of Wisconsin jobs to all US jobs. Since the mid-1990s the Wisconsin share of US jobs has steadily declined, as shown below.

Wisconsin Jobs as % of US
In light of the actual record, the relevant question is whether Walker’s policies contributed to subpar growth. As with so many public policy issues, sorting through the various possible causes is a challenge. But one thing is clear: job growth has been poor, compared to the rest of the country, under Walker.
Schimel and Gerrymandering
Attorney General Schimel recently released his brief arguing the US Supreme Court should overturn a federal district court’s ruling rejecting Wisconsin’s gerrymandered legislative districts. Rather than accepting the obvious evidence that the drafters of the district plan worked very hard to favor Republicans, Schimel puts the blame on demographics:
So far, electoral results for the Assembly under Act 43 have proven remarkably similar to the most recent results that obtained under the court-drawn plans. This is a reflection of Wisconsin’s political geography, where Democrats concentrate in urban areas like Madison and Milwaukee, as well as incumbency advantage. Indeed, the only way the Legislature could have attained Plaintiffs’ desired election results would have been to “engage in heroic levels of nonpartisan statesmanship” by abandoning Republicans’ advantage under court-drawn plans, including by adopting a plan under which incumbents were more likely to lose their seats.
Here the trick is slightly different than Walker’s attempt to take credit for a non-existent jobs advantage. Instead Schimel takes what appears to be a minor contributor to the Republican advantage and turns it into the whole explanation.
The next chart shows estimates of how many seats each party would win depending on the percentage of the vote they win. It is based on vote totals from the 2008 presidential election. The districts were set by a panel of federal judges after the 2000 Census. Although the judges’ redistricting gives a slight advantage to Republicans in a close election, the two lines are very close to each other, suggesting each party would win about the same number of seats with the same percent of the statewide vote.
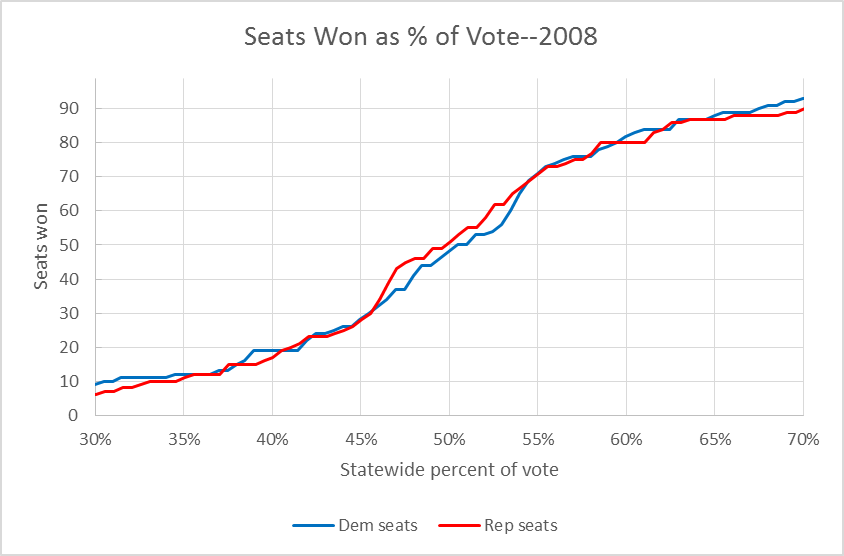
Seats Won as % of Vote–2008
The next chart shows the effect of the Republican gerrymander in Act 43. Now there is a yawning gap between the ability of each party to translate votes into seats. If the votes are split evenly Democrats have an advantage in 36 districts, compared to 63 for Republicans. For Democrats to have an even chance of winning control, they need about 55 percent of the vote.
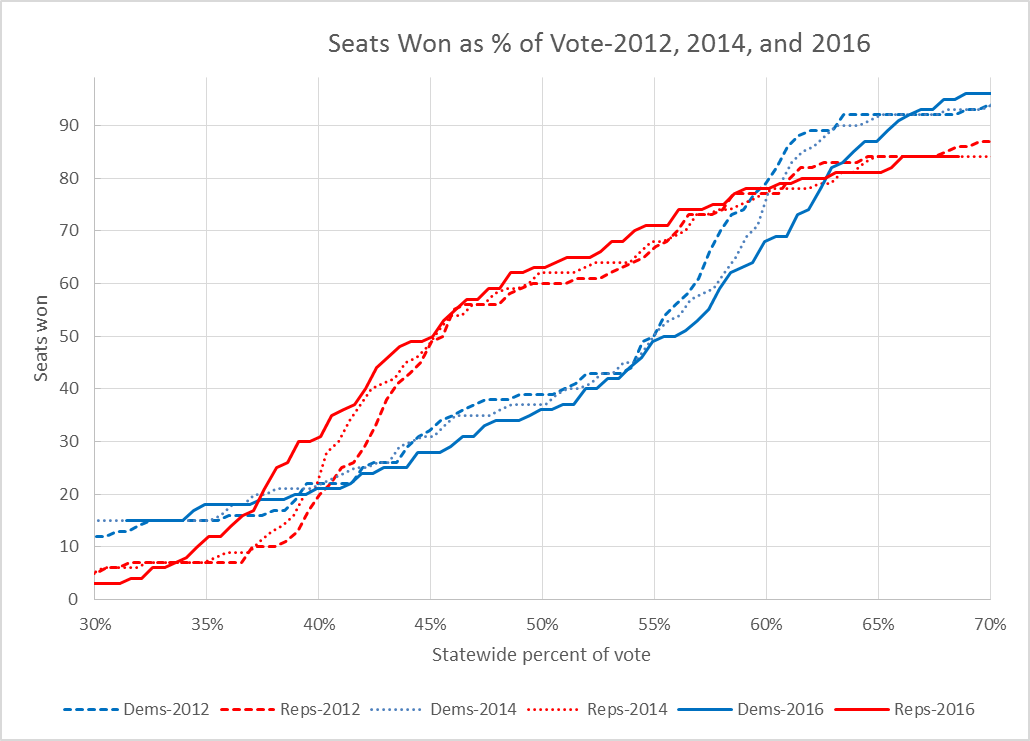
Seats Won as % of Vote–2012, 2014, and 2016
A law that said Democrats need 55 percent of a district’s vote to win that district would have the same result as Act 43. Clearly, however, the Supreme Court would reject it.
Perhaps the strongest evidence against Schimel’s argument that the Republican advantage resulted from Democrats’ tendency to live in cities is the record of how the districts were developed. The unchallenged court record shows that consultants hired by Republican legislators produced a steady stream of maps, each more favorable to the GOP. Producing such a map that gives such a large advantage to one party does not come easily.
The Trump Administration and Jobs
President Trump is best known for his alternate facts, but his staff also indulges in assigning dubious causality where convenient. The February jobs report caused jubilation Trump land. Reince Priebus tweeted: “@POTUS Trump delivers in first #JobsReport. 235,000 new jobs and unemployment rate down to 4.7%. Great news for American workers!” Sean Spicer tweeted along similar lines: “Great news for American workers: economy added 235,000 new jobs, unemployment rate drops to 4.7% in first report for @POTUS Trump.”
Start with the Trump folks’ eagerness to claim credit for the 235,000 monthly jobs figure. As many observers pointed out, the February economic policies were largely inherited from the Obama administration.
As the graph below shows, a monthly growth of 235,000, while good, is consistent with the past six years under the Obama administration. The mean monthly growth during Obama’s second term has been 201,000 with a standard deviation of 77,000, putting the February growth well within the expected variation.

Monthly US job increase
This past January, the Congressional Budget Office issued its Budget and Economic Outlook: 2017 to 2027. Here is a paragraph from the summary:
CBO’s economic forecast—which underlies its budget projections—indicates that under current law, economic growth over the next two years would remain close to the modest rate observed since the end of the recession in 2009. Nevertheless, economic growth would continue to outpace growth in potential (maximum sustainable) GDP and thus continue to reduce the amount of underused resources, or slack, in the economy. The result would be increases in hiring, employment, and wages, along with upward pressure on inflation and interest rates. In the later part of the 10-year projection period, output growth would be constrained by a relatively slow increase in the nation’s supply of labor.
It should be noted that this report assumes a continuation of the Obama economic policies. Trump or his proposals are never mentioned. If Hillary Clinton were the incoming president, the CBO projections would have been identical.
That said, the CBO’s projections contain both good and bad news for Trump. If, as seems likely, the labor market will tighten in the next couple of years, this is good news for workers—and many of Trump’s hard-core supporters. Doubtless, Trump will take credit for this. The bad news for Trump is that as the slack disappears it will be difficult to achieve his ambitious goals for the economy—or even maintain the slow but steady growth of the Obama years.
These three examples are all on the right side of the political spectrum. Yet recent research shows that “confirmation bias”—the tendency to uncritically accept claims that support our previous biases—is hard-wired in humans. This suggests that there should be similar examples of people on the left rashly jumping from correlation to causality. Why are they so hard to find?
Data Wonk
-
Who Do You Trust to Conduct Elections Fairly?
 Apr 6th, 2026 by Bruce Thompson
-
Is Non-Citizen Voting a Real Threat to Elections in Wisconsin?
Mar 18th, 2026 by Bruce Thompson
-
How Global Climate Change Affects Milwaukee
 Mar 11th, 2026 by Bruce Thompson


And the Ryan healthcare bill failed because ‘there were no democratic votes for it ” .
( How does DJT know that if the vote never was taken ??- That’s Donald’s world and rationalizing again )
LIes, damned lies and statistical lies!