
2016 Election Results Prove Gerrymandering
State election totals by ward prove the problem again. How will courts react?
![How to Steal an election. Image by Steven Nass (Own work) [CC BY-SA 4.0 (http://creativecommons.org/licenses/by-sa/4.0)], via Wikimedia Commons.](https://urbanmilwaukee.com/wp-content/uploads/2016/06/How_to_Steal_an_Election_-_Gerrymanderingj.jpg)
How to Steal an election. Image by Steven Nass (Own work) [CC BY-SA 4.0 (http://creativecommons.org/licenses/by-sa/4.0)], via Wikimedia Commons.
At the time the judges were considering the case, they had results from two state-wide elections using assembly districts created as the result of the 2010 census: the presidential election of 2012 and the governor’s election of 2014. Since the decision was issued and my previous article on gerrymandering was published, the Wisconsin Elections Commission has published presidential election results broken down by individual wards. Thus it is possible to calculate which presidential candidate won each assembly district and how skewed those districts are.
A basic test of political fairness is symmetry; if the bar is set at a certain level for one party to get a certain result, to the extent possible it should not be set at a much higher level or lower level for the other party. As with the 2012 and 2014 election results, 2016’s result show a remarkable asymmetry. For example, to win 50 seats, a majority, Republicans need about 45 percent of the votes. But Democrats need 55 percent of the vote to gain a majority.
The chart below shows the estimated seat counts for each party based on the 2016 results (solid line), as well as 2012 and 2014. Wisconsin elections are typically won and lost with differences of a percentage or two. In this range, the Republican advantage (red lines) is overwhelming and persistent as the judges determined: at 45 percent of the vote the GOP won 50 of 99 seats, at 50 percent they won 60 or more seats, at 55 percent they won about 70 seats in the three elections.
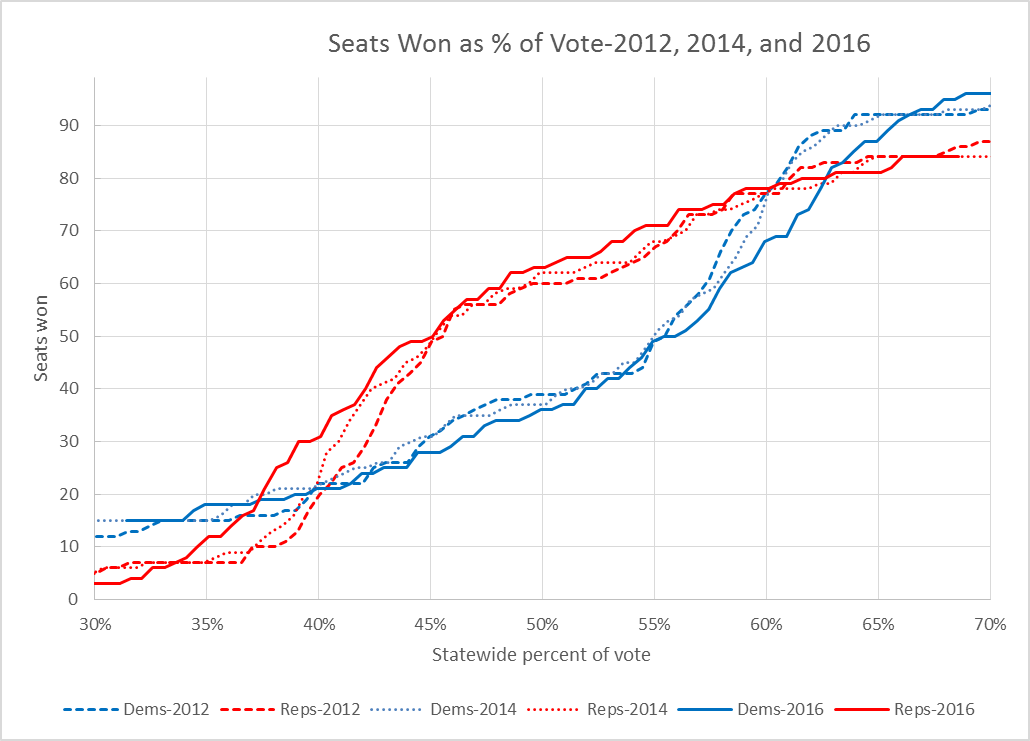
Seats Won as % of Vote-2012, 2014, and 2016
One reason the Supreme Court justices have hesitated to rule against gerrymanders is a fear that uncertainty about how to measure the inequity would plunge courts into a sea of possibly inconsistent rulings. The plaintiffs challenging the Wisconsin gerrymander thus suggested the “efficiency gap” as a mathematical tool to measure the asymmetry of the redistricting. It is based on the concept of “wasted votes”—those supporting a losing candidate and those that were unneeded because the candidate already had enough votes to win. The strategy behind partisan gerrymandering is to make sure the other party has the most wasted votes.
The efficiency gap calculates whether one or the other party has a substantially greater proportion of wasted votes. Under that analysis, a negative efficiency gap favors Republicans; a positive one favors Democrats. Generally, gaps of more than plus or minus 7 percent are considered strongly indicative of deliberate partisan gerrymandering.
As the next chart shows, over the past three state-wide elections, the efficiency gap has been worse than -7 percent in the range that Wisconsin elections are fought. Efficiency gaps calculated from all three elections since the 2011 redistricting are remarkably consistent with one another and strongly favorable to the election of Republicans.
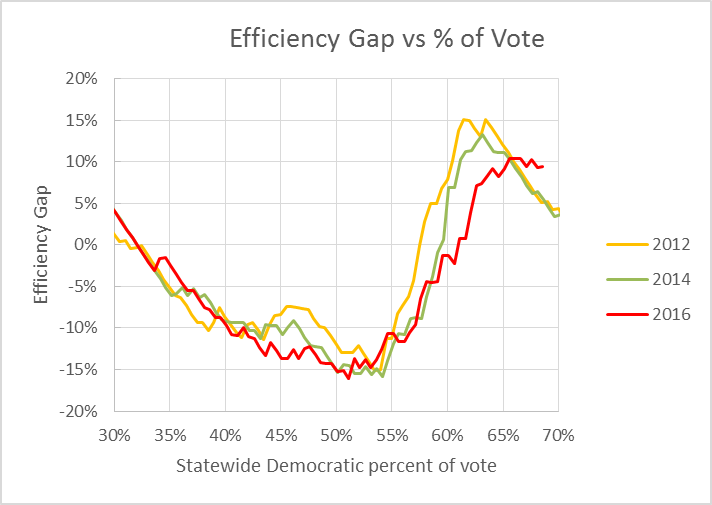
Efficiency Gap vs % of Vote
The basic strategy behind creating a partisan gerrymandering is called “packing and cracking.” Packing is the process of adding voters from the other party to districts that already have an overwhelming majority of that party’s voters. By removing these voters from districts in the middle, the number of districts favoring one’s own party can be increased or made safer.
The frequency diagram below shows the classic cracking and packing symptoms. The long blue Democratic tail on the right results from packing Democratic voters into heavily (more than 60 percent) Democratic districts. The red peak of the many districts between 50 percent and 60 percent Republican reflects cracking of districts that previously had small Democratic majorities, were evenly split, or had small Republican majorities: now all have solid GOP majorities.
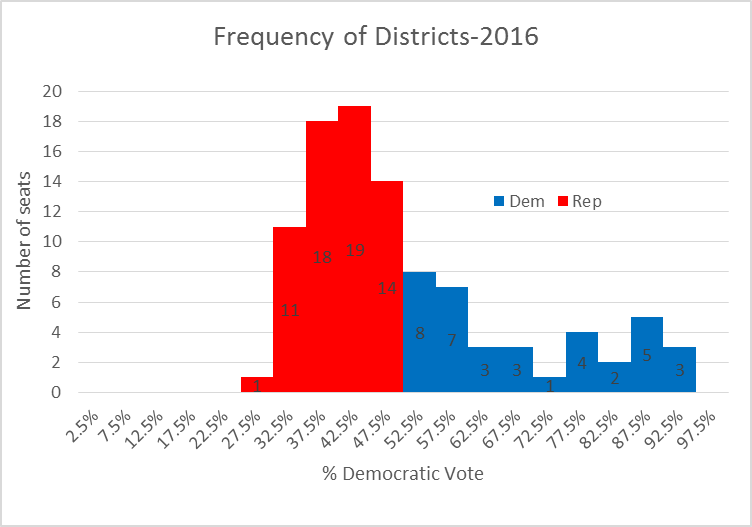
Frequency of Districts-2016
The 2016 results help confirm—if any confirmation was needed—the court’s conclusion that the Wisconsin districts are the result of deliberate gerrymandering. The consistency of the results over three elections should reassure judges who fear they will make decisions based on calculations from one election only to have the evidence underlying those calculations disappear in subsequent elections.
What is likely to come next? Both sides have submitted briefs advocating what the court next step should be.
Wisconsin Attorney General Brad Schimel, arguing for the defendants, advocates that “the Court should therefore enter an injunction (that) directs the Legislature to devise a new plan.”
But then he argues that the judges should wait for the Supreme Court to rule: “The real issue with respect to remedy is the timing of when a legislative alternative should be presented. Given the uncertain nature of the law on partisan gerrymandering, the Court should not require a revised plan until after the Supreme Court has ruled on the case. “
Essentially, Schimel’s argument is that it would be inefficient for the legislature to devise a new plan in case the Supreme Court were to disagree with the panel of judges.
The plaintiffs propose several possible scenarios. Their preferred choice is not allowing the state first crack at coming up with new districts. They advance two reasons for this. The first is that the legislature’s record of devising the previous plan is so poor there is no reason to expect they would do better in a second try.
They also turn a previous argument by the state against the state. In a previous case (“Baldus”), the state argued that language in the Wisconsin constitution allowing one redistricting every 10 years prohibited the legislature from revising its districts.
The plaintiffs argue for the judges to take control of the redistricting, suggesting several ways to manage the process.The plaintiffs further argue that “If the court does allow Wisconsin’s elected branches to try to design a valid remedy, it should give them a strict deadline and detailed instructions.” They then lay out a suggested schedule aimed at having new districts available in time for the 2018 election. This would include a deadline for the legislature to develop a new plan, time to evaluate it, and, in case the plan was unsatisfactory, time for the judges to develop a substitute plan.
In essence, new districts would have to be in place when candidates start collecting signatures on April 15, 2018.
Lawyers for each side now have an opportunity to critique the other side’s proposal before the court decides on the next step.
It is always risky to predict what judges will decide. Still, I think it unlikely they will agree to Schimel’s proposal. Part of the problem is timing: Schimel’s proposals offers no assurance that a revised districting plan would be available in time for the next legislative election in 2018. More seriously, the effect of his proposal would be to convert the judges’ decision into a brief to the Supreme Court, communicating a lack of confidence in their own decision and openly inviting a reversal. Why would the judges want to do that?
More about the Gerrymandering of Legislative Districts
- Without Gerrymander, Democrats Flip 14 Legislative Seats - Jack Kelly, Hallie Claflin and Matthew DeFour - Nov 8th, 2024
- Op Ed: Democrats Optimistic About New Voting Maps - Ruth Conniff - Feb 27th, 2024
- The State of Politics: Parties Seek New Candidates in New Districts - Steven Walters - Feb 26th, 2024
- Rep. Myers Issues Statement Regarding Fair Legislative Maps - State Rep. LaKeshia Myers - Feb 19th, 2024
- Statement on Legislative Maps Being Signed into Law - Wisconsin Assembly Speaker Robin Vos - Feb 19th, 2024
- Pocan Reacts to Newly Signed Wisconsin Legislative Maps - U.S. Rep. Mark Pocan - Feb 19th, 2024
- Evers Signs Legislative Maps Into Law, Ending Court Fight - Rich Kremer - Feb 19th, 2024
- Senator Hesselbein Statement: After More than a Decade of Political Gerrymanders, Fair Maps are Signed into Law in Wisconsin - State Senate Democratic Leader Dianne Hesselbein - Feb 19th, 2024
- Wisconsin Democrats on Enactment of New Legislative Maps - Democratic Party of Wisconsin - Feb 19th, 2024
- Governor Evers Signs New Legislative Maps to Replace Unconstitutional GOP Maps - A Better Wisconsin Together - Feb 19th, 2024
Read more about Gerrymandering of Legislative Districts here
Data Wonk
-
Who Do You Trust to Conduct Elections Fairly?
 Apr 6th, 2026 by Bruce Thompson
-
Is Non-Citizen Voting a Real Threat to Elections in Wisconsin?
Mar 18th, 2026 by Bruce Thompson
-
How Global Climate Change Affects Milwaukee
 Mar 11th, 2026 by Bruce Thompson


There were some uncontested elections – were these imputed with swing-adjusted presidential election data, or left as is? i’m presuming left as is.
I checked the wisconsin election commission website – i can’t use that data, it’s not machine readable. (who came up with that format?!? what were they thinking?!?)
I need something like the files posted here: https://legis.wisconsin.gov/ltsb/gis/data/
then i can write a script to aggregate by-district.
then i can run that for 2012, 2014, and 2016, and plug them in here: http://autoredistrict.org/count4.php
(it needs 3 elections because it has to calculate both a mean and a variance.)
update: i was able to find usable tabular data for wisconsin assembly 2016 on ballotpedia.
not sure if it’d even work with uncontetsed elections, might need to impute.
maybe a project for the new year weekend – to aggregate the 2012 and 2014 data and plug it in.
I compiled the 2012, 14, & 16 WI assembly results into a spreadsheet, and posted it publically online for convenience:
https://docs.google.com/spreadsheets/d/1hXawIOr2K9BPp6QCOQUv2voPhaXFEgVIDtmXjcYOEhU/edit?usp=sharing
it also includes 2012 presidential election results by district, for imputing uncontested elections.
Plugging that data into my speech-per-vote calculator
( http://autoredistrict.org/count4.php )
i get:
Democrats: 2.22E-05 bits of information per vote
Republicans: 2.52E-05 bits of information per vote
Making each republican vote count as much as about 1.13 democratic votes.
Or put otherwise, the current map effectively disenfranchises about 1 in 10 democratic voters. Which comes out to about 92,232 voters.
Illinois pulled the same Gerrymandering trick twenty-five years ago and the Democrats have dominated that state for a quarter of a century. Illinois politicians also paid themselves lavished benefits which have left the State insolvent. Last I looked the Milwaukee Democrats on the County board did essentially what the Wisconsin State Republicans did. Isn’t politics about eliminating the other side. If Clinton has a tape that makes Trump look like pervert you play it. If the Russians have something on the Democrats involving emails you play it.
Jason, that was investigated in a Bruce Murphy article – couldn’t find a single example of Democratic gerrymandering in Wisconsin.
Nationwide right now, for congressional districts at least, pro-Republican gerrymanders outnumber pro-Dem onces by an enormous margin.
Here’s an analysis of all 50 states, and you can sort them by the amount and direction of gerrymandering:
http://autoredistrict.org/all50/version3/CD_PRES/sortable_2010.php
only states with an appreciable pro-dem bias are texas and maryland. conversely there are about 23 states with an appreciable pro-rep bias. the ratio is literally about 10:1.
Think about it – by the popular vote, america has been electing a democratic majority in congress since 2010, yet the votes consistently resulted in precisely the opposite: a republican majority in congress.
how? well, because: http://www.redistrictingmajorityproject.com/
Jason, here’s the article: http://urbanmilwaukee.com/2016/01/26/murphys-law-the-myth-of-democratic-gerrymandering/
Jason you sure are cynical. Eliminating the other side? Is that really all politics is? Also, your defense is weak. It’s what a small child says. “Well he did it too!”
It’s a well known fallacy. The formal name is “ad hominem tu quoque”. (at the person, you as well). One of the three major forms of ad hominem, the other two being abusive and circumstantial. In turn, ad hominem falls under the broader category of fallacies of irrelevance. It is fallacious because the qualities or situation of a person – real or imagined – have no bearing on the truth or falsity of the initial claim; it’s irrelevant.
It gets its (undeserved) persuasive power from a cognitive bias known as the halo effect: https://en.wikipedia.org/wiki/Halo_effect
Also in this case I’d say it’s a rather blatent instance of deflection:
http://www.abuseandrelationships.org/Content/Behaviors/other_focus.html
Vince, how naive are you. Do you think when President Obama sat down with a bunch of House Republicans to discuss the 2009 stimulus and the Affordable Care Act that he was going to let their ideas be apart of his policies. Obama stated elections have consequences and he blew the Republicans off. Similarly, Senator Mitch McConnell sitting in the minority stated his number one priority was to make Obama a one term President. Politics is a blood sport.
I’m naive? Coming from the guy who believes Trump really is draining the swamp. Priceless. Listen Jason, no one said politics is pleasant, but your defense still is at the level of a toddler’s. That politics can be nasty is no excuse.
“Vince, how naive are you.” – and that one’s ad hominem abusive.
“Do you think when President Obama sat down with a bunch of House Republicans to discuss the 2009 stimulus and the Affordable Care Act that he was going to let their ideas be apart of his policies. ” – umm… they already were. The affordable care act was based off of Romneycare. http://obamacarefacts.com/romneycare-romneyhealthcare/
“Senator Mitch McConnell sitting in the minority stated his number one priority was to make Obama a one term President.” yep. and they sure kept to their word, blocking everything. point taken: republicans are selfish insular psychopaths who don’t care about americans. this i won’t dispute.
Clearly he thinks he is revealing some kind of hard truth when he states politics is nasty. That is hardly earth-shattering, and it doesn’t and shouldn’t mean that anything goes.
One effect of extreme gerrymandering is that disqualifies many voters–in Wisconsin’s case, about 1 in 10. It consistently thwarts democracy. That breeds cynicism and all sorts of abuse.
Politics may be a blood sport in Game of Thrones, etc. but American democracy had higher aspirations. One goal of democracy is to temper the power-mongering tendencies of politicians. Wisconsin’s gerrymandering lets such ruthlessness flourish and go unchecked. Corruption is inevitable–benefiting the politicians but not the people–of either party.
“Stop punching me.”
“Sometimes people get punched. Ergo, you have no right to complain.”
Seems legit. Doesn’t sound at all like an abusive relationship.
It seems to me that both sides prefer “safe” seats, all things considered, and that we would end up with less divisive politics if our representatives had to face a broad spectrum of voters. Of course, for those who prefer their far right or far left views be heard, this would be a step backward.
Stop whining Lefties, the people are rejecting you and your ideas. Look at the results, the last ten years.
That is a really good point WCD. You are going to change a lot of minds with insight like that. Kudos.
oh, but let’s look at the history of the climate.
for the first 500 million years there was no life on earth
for 200 Billion years after that the climate was entirely incapable of supporting animal life. there was no oxygen, you see.
ironically, the sudden oxygenation (aka “oxygen holocaust”) led to a mass extinction.
in it’s course there have been 5 great extinction events, each one killing off between 75% and 95% of all species on the planet.
The most recent of which – and also the biggest – was caused by a population explosion of methane-producing microbes https://en.wikipedia.org/wiki/Methanogen which led to a run away greenhouse effect that killed off 96% of all marine species.
Wrong story happyjack?
yep… 😛
It happens. I’ve done it. Wish they had an edit comment feature.
On Wisconsin!
“the Electoral Integrity Project, which produces something called the Perception of Electoral Integrity, in which the 50 states are ranked by a number of criteria. Wisconsin, where so many of the good-government programs of the 20th century were born, now ranks below every other state in the PEI rankings except Arizona.”
https://www.electoralintegrityproject.com/featured-dataset
I appreciate the thoughtful comments. Here are some technical notes on the calculation of the efficiency gap.
Just adding up the number of votes for Democrats and Republican candidates for, say, the Assembly begs the issue of what to do about uncontested races where there is a Democratic candidate but no Republican, or vice versa. Assuming that there is no support for the missing party distorts the result. In Wisconsin, doing so understates Republican support. There are two possible solutions to this problem:
1. Use the actual Assembly vote for contested seats. For uncontested seats use regress the vote for contested seats versus the vote for a statewide contest (president or governor) to estimate the number of votes that would have gone to the missing candidate.
2. Use the vote in each district for each statewide candidate.
I used the second approach with the 2016 election results. When I tried both approaches with 2012 results, the results were essentially the same.
“Look at the results, the last ten years.”
Perhaps you missed the part where for the last ten years the voters voted for a Democratic congress.
Since the modern democrat party started, after loss of Bob jr. to McCarthy, the state has been 47/47.
However the Left votes are far more cocentrated around the urban areas and the minorities, so almost always the left seats are more heavy Left, than the GOP cause the Red counties are dominant.
WCD, this self-sorting political geography phenomena is well known.
It can be easily calculated by making a bunch of random maps.
The WI redistricting maps created by the GOP far exceeds this effect.
As do most of the GOP gerrymanders throughout the country.
Furthermore, this effect can be easily counteracted by using computer algorithms (such as heuristic search) that optimize for partisan symmetry, making it a moot argument to begin with.
Here’s an article from Bruce showing how optimization algorithms can be used to create fair redistricting, despite natural gerrymandering effects described by Chen and Rodden:
http://urbanmilwaukee.com/2016/01/06/data-wonk-can-new-approach-end-gerrymandering/
WCD (18): “the people are rejecting you and your ideas. Look at the results”
OK, let’s look. In the 2016 Wisconsin congressional elections. Democrats received 52.07% of the statewide vote, yet they ended up with 3 of 8 congressional seats. How could that be?
Likewise, in the 2016 Wisconsin State Assembly elections, Democrats received 52.79% of the statewide vote, yet they ended up with just 35 of the 99 assembly seats. How could that be?
I thought voters were rejecting Democrats? Seems you’ve assumed that without looking at what voters actually want vs. what they get.
it is quite simple. The Dems are heavily contracted in urban areas so ignorer to make it 50/50 they would have to break up contiguous dissects which has been unconstitutional by SCOUS.
In order to do that you would have to gerrymander..
WCD, see bruce’s earlier article that i linked to above, which shows how you can use multi-objective optimization to create a fair map for Wisconsin assembly districts without making discontinuous regions.
Also I used multi-objective optimization to make fair U.S. congressional districts that are constitutional by SCOTUS for all 50 states. You can see them all along with detailed stats here:
http://autoredistrict.org/all50/version3/CD_PRES/interactive_map.php?source=CD_SM
you can also compare with other redistricting methods there.
Percent of vote is meaningless unless taken on state wide elections cause Kind was not challenged last year, as were so many legislative seats.
Give your plan to Kessler, he can use it next time he gets in power.
Fair??? Funny! We suffered under the Left for too long, with their ideas of fair. Jimmy carter said: “life, politics are not fair”. Grow up, its is a hard tough world.
Well that was just all over the place.
You claimed that you can’t make maps that have both partisan symmetry and are contiguous.
I proved your ridiculous claim false.
Suck it up.
Quit whining!!!
???
Is that what you say when you someone proves something you said to be false?
When you get a bad grade on a test, do you tell your teacher to quit whining?
Do you ever wonder why they just give you a strange look and continue on grading papers?
It’s because “quit whining” is not even a sensical response to being corrected.
It’s like you’re hearing voices and talking to them – like you’re schizophrenic.
Dems should spend more time trying to get votes by worrying about the working peoel instead of Global warming, toilets, taking away voters guns, killing babies and maybe they might win something.
Dems do worry about the working people. Their the ones pushing for legislation like minimum wage, jobs for vets, etc, that Republicans keep blocking.
What does this have to do with gerrymandering?
Dems cannot win, not because of redistricting, they have lost thousands of seats, Presidency, governors etc.
In the last ten years, since Obama, the working people have lost jobs, income, no raises, net worth. Read the stats dummy.
Min wage is nothing to the middle class working people, Vet jobs have been pushed by the Conservatives forever. I have three kids in service we check that.
Dems have tried to do a lot to help the working class, but repubs have been blocking everything.
What does this have to do with gerrymandering?
Dems did get the majority of votes in the assembly. were it not for gerrymandering, they’d control the assembly right now.
WCD is post-truth. He only believes news he gets from Facebook friends. For example, in his world Obama has been president for 10 years. If things are bad, they are Obama and Doyle’s fault. Anything good is because of Walker.
Percent of vote is meaningless
No, it isn’t.
52% of the State of Wisconsin wants a Democrat to represent them in the House.
48% of the State of Wisconsin wants a Republican to represent them in the House.
You can draw up arbitrary lines to manipulate the outcome of those FACTS, but those FACTS will remain.
The people are rejecting Republicans and their ideas.
The full comment was “Percent of vote is meaningless unless taken on state wide elections cause Kind was not challenged last year, as were so many legislative seats.”
I believe WCD was referring to the problem of uncontested seats.
This is what imputation is for. ( https://en.wikipedia.org/wiki/Imputation_(statistics) ) It solves this problem.
There are generally 2 methods of imputation when dealing with election data:
1.) average together data for the same districts from chronologically nearby elections, when the seat was contested, after adjusting to match the uniform partisan swing for elections that were contested in both.
2.) use a different election, such as the presidential election, and adjust the uniform swing for those districts that were contested to match that of the election in question, then substitute the data in on the uncontested elections.
of course these are imperfect – they are statistical expectations – but the result is more accurate than the other 2 options:
1.) doing nothing
2.) throwing out uncontested elections altogether.
anyways, long story short, after imputing – with either of the two imputation methods – the fact remains that the majority voted democratic.
Kevin/HappyJack, why continually switch between names?
Bruce Thompson, I’d love to see how 2016 data works out if you use voting patterns on national races to account for uncontested districts. 2012 may have been unique in that it aligned with your current method?
the data for 2102,2014, & 2016 is aggregated here:
https://docs.google.com/spreadsheets/d/1hXawIOr2K9BPp6QCOQUv2voPhaXFEgVIDtmXjcYOEhU/edit?usp=sharing
there’s also an imputer on the far right the input in and input out columns, that’ll use the 2012 presidential, swing adjusted, for uncontested races.
you can see for yourself just by by copying and pasting the races into the impute in and totalling up the impute out.
if you want to generate seats votes curve, just order it by % dem and turn that into a line chart (x=row number, y = % dem), then flip it 90 degrees, then reflect that about x and y.
..actually i’m not sure that’ll work – might give you a bit of a warped curve.
you could also use autoredistrict to get seats-votes curve. 2012 and 2014 election shapefiles are available here: https://legis.wisconsin.gov/ltsb/gis/data/
2016 isn’t available ye, apparently.
added another sheet to the google sheets xls: “imputed totals”.
apparently in 2014 & 2016, repubs would have gotten the popular majority if all seats were contested.
also shows the proportional seat allocation and the resulting seat allocation. pretty stark contrast.
again though, to be sure, you have to look at the seats-votes curve, and calculate the partisan asymmetry from that.
single-winner plurarity voting systems seats-votes curves follow a cumulative normal distribution, rather than a diagonal line. so to measure gerrymandering you have to compare the seats-votes curve with its mirror image.
on second thought, i was right about the quick and easy way to make a seats votes curve.
since to get 50-50% on a district that’s x% dem, y% rep, you multiple the votes by y% vs x%. so it works out perfectly.
check out sheet 2 of:
https://drive.google.com/file/d/0B4CYxOCd51YqdG1JcGFyU3ZoRWs/view?usp=sharing
just sort the district vote counts first column hight to low, copy and paste those into the yellow columns, and the seats-votes curve will appear in the chart.
Funny how did that effect the congressional vote, senate and prudent.
You must take into effect, that fact that no one ran in many districts, and in Kind district.
The problems came with the lack of votes in Inner city now that Obama was not on ticket, not redistricting. It is just one long whine from the Left blaming the Russians, Comey, the phase of the moon and my little sister.
WCD, i see you haven’t been following the conversation.
to compensate for uncontested districts, you do a process called imputation.
then having done that, to look for gerrymandering, you construct a seats-votes curve from that, and reflect it about the origin. if it’s fair, the seats-votes curve is symmetric (e.g. if 60% rep votes give republicans 70% of the seats, then 60% dem votes will give dems 70% of the seats). if it’s gerrymandered, than it won’t be symmetric, and you’ll see a big gap between the seats-votes curve and it’s reflection about the origin.
As Bruce has already stated, and as you can clearly see in sheet 2 of the spreadsheet i shared here: https://drive.google.com/file/d/0B4CYxOCd51YqdG1JcGFyU3ZoRWs/view?usp=sharing
after imputation, the curve remains very asymmetric, in other words, highly gerrymandered.
This is a robust result – it holds for the 2012, 2014, and 2016 election. In fact, the curves don’t change very much between elections.
I have studied, and helped make election law for 50 years, been an election official for decades, know more than all of you put together.
Fact is that the left did not turn out for an terrible candidate, that no one trusted and the Dems, in Wis,. put up terrible candidates and did not run a GOTV of any value.
That dummies is what counts, not the BS from Baas.
Not sure if i believe you (after all, this is the internet), but apparently all that studying and work, and you still can’t do a simple imputation and read a seats-votes curve.
And all of your studying and work (nor your your rather high self-assessment! – and/or conversely low assessment of others) can’t change the facts, available as public record for all to see.
WCD, maybe you should submit an amicus brief for defendents in Whitford vs. Nichols when it goes to the supreme court.
I’m sure your 50 years of experience that apparently only taught you the rather trivial task of insulting of a political party with out actually doing any analysis of the distribution of voters and district (which everyone here can do, btw) will impress the judges.
You cannot insult idiots, like the Lef,t and how they have lost the whole country int he last 6 years. Stop Whining talks about people problems and you might win.
#53. State do not lie, but dummies figure stats.
With that one comment you’ve just convinced me that there was no gerrymandering.
I’m sorry I underestimated your expertise and your powerful reasoning skills. It will never happen again.
“dummies figure stats.”
so math and empirical data is for stupid people. gotcha.
thanks for helping me to see the error of my ways.
Before you get old and smart, you must be young and stupid. There are far too many variables, in elections, to rely on just base numbers: turnout, issues, candidates, TV, media, radio, debates, campaigns etc.
you’re right, map drawers should be able to just draw thing however they like and gerrymander it all to hell, because t.v.
it’s too complicated to see if democratic voters are packed into uncompetitive districts by looking at the election results to see if they’re packing into uncompetitive districts.
your wisdom trumps judicial precedent. you should submit an amicus brief.
also, you’re old and smart, i’m young and stupid. thanks, i was clearly getting on a high horse there. i will learn humbleness from your example.
Nice tha you admit that you re an idiot. If you go back to Nixon/Regan, they won Wisconsin then compare Obama to Trumo, Feingold/Johnson and your see changes in voting patterns all over the place.
Tosa was solid GOP when Walker won Assembly seat, now solid Dem. West Allis went different. South side all over the place as has been the west part of state. I could show you maps and changes all day.
Your number,s for a few elections ,are meaningless.
Not one of you have not even mentioned the obvious way to change the map, and that is if the incumbents do crappy job.
Look to see when Zablocki got 80%, then when Proxs swept everything. Grow up your case is just crap. Get some good candidates, make some sense with your programs and you will change map asap.
It is the Dems turn but they are just too stupid to see that, so sit back and let us fix things dummies.
yes. demographics and candidates change over time, therefore wisconsin is not gerrymandered.
i conceded your flawless logic earlier, when you mentioned t.v. and campaigns.
I still have one question that maybe you can enlighten me on:
you mentioned turnout, issues, candidates, TV, media, radio, debates, campaigns etc.
how might we measure the aggregate of all these things in an election?
Or maybe we simply can’t?
Trying to think how one might capture that information… if it’s even possible in an election….
merry christmas: https://drive.google.com/file/d/0B4CYxOCd51YqbG5pNDc3ZHhOd00/view?usp=sharing
sheets 2012,2014, and 2016: the seats-votes curve for the assembly elections, with uncontested imputed with swing adjusted 2012 presidential election.
as Bruce said, basically the same as without imputing. (note my graphs go from 0%-100%, whereas bruce zoomed in on 30%-70%.)
I missed this comment: “2012 may have been unique in that it aligned with your current method?”
Bruce graphed not only 2012, but also 2014, and 2016. They all show the same extreme asymmetry. That was kind of the whole point of the article.
Didn’t realize you didn’t notice that. That graph up there captioned “Seats Won as % of Vote-2012, 2014, and 2016”, shows the seats on as % of vote for 2012, 2014, and 2016.
To AG,
For the graphs in the article I used the Clinton-Trump vote. Switching to the actual assembly votes gives an efficiency gap (using the so-called “simplified” method) of -12% (favoring the Republicans). Only half the districts (50) had 2 candidates. For the others I used the Clinton-Trump using regression to estimate what the assembly vote would be if there were two candidates. The similarity of the results is not surprising but reassuring, I think. What is perhaps more surprising is how consistent the results have been in all three elections since the latest redistricting, despite Trump’s ability to attract former Obama voters in areas hit by globalization.
Bruce, it makes Conservatives happy to see dopey Lefties spending all their time on something that doe not matter. By the time this gets out of court it will be 2020 and void.
Concentrate on some intelligent issues like stoping crime, teaching kids to read, jobs and economy,
Getting some decent candidates and you will win, Maybe.
Spoken like a true bully, WCD. Adding insult to injury, among other things.
“The right of voting for representatives is the primary right by which all other rights are protected. To take away this right is to reduce a man to slavery.” – Thomas Paine
You’re welcome.
Murphy we cannot thank you enough to have you let these lefties prattle on all day and never find the answers:
Go to work you white, liberal, male, racists: MPS, crime, abandoned houses, Heroin, corruption, uneployemtn, jobs, human trafficking and more. fix these and the come back and brag or the state is going to have to take you over.
If everyone is a racist, is anyone really a racist? Why are you so casual with that word?
The people that run Milwaukee are all white, all male, and all Liberals who keep the Blacks and Hispanics inter ghettos, uneducated without jobs. If that is not racist then what is???
The people that run Wisconsin (like Walker and Vos) are all white, all male, and all Republicans who keep black and Hispanic people in their ghettos, uneducated without jobs. If that is not racist then what is?
The difference is that the GOP has done as much as possible to help the kids get educated in Milwaukee, and are going to have to take over Milwaukee if the crime is not solved. Milwaukee, MPS is disaster, that is why we have vouchers for 30,000 kids, Chap 220, Tommy tried to take over the schools. Only people who care about the Inner cities the Conservatives.
Only a delusional racist would believe that. Privatizing schools so that they are unregulated and can teach creationism and whatever else they want is not putting the interests of the students first. What are legislators doing to fight crime in Milwaukee? They pass laws that Flynn and law enforcement object to, which doesn’t help fight crime in Milwaukee. How much time has Walker spent in the inner city? Or other GOP legislators? Just look at what they prioritize: cutting taxes and regulations, gutting the DNR, defunding higher education, getting rid of Obamacare, gutting the social safety net. None of that helps the inner city. You and other white male Republicans are deplorable racists.
for all of those racists that do not care about Black and Hispanic kids you are right to throw them back into MPS a nationals disgrace. You make me sick, no wonder Milwaukee is 6th worst fro crime in country according to Frobes. Peoel like you round ad her in their blog.
Proofread please WCD. There are so many errors in that post your meaning can’t be deciphered. I think you are agreeing with me that white male Republicans like Scott Walker and yourself are racists who do nothing to help improve education or reduce crime because you don’t care about those issues as anything but a way to bash Milwaukee.
busy answering 1000 emails, you re not worth proof reading.
Do you at least proofread your emails before replying? Probably not as clearly spelling and grammar are not things white supremacists care about.
Sorry to comment on an old thread. Saw it reposts in my facebook feed, read over the comments, realized I was unclear on something.
My comment #63 was being facetiously disingenuous.
Those things WCD mentioned, campaign aids, debates, turnout, etc., that he claimed couldn’t be measured in gerrymandering, their aggregate effect, as well as their geographic distribution, can all be measured by THE ACTUAL VOTE COUNTS !
Hmm… How can you measure the aggregate of past events on how they effect people’s perceptions and opinion leading up to an election?
I don’t know maybe by having them record their resulting preferences on a ballot and tallying up those ballots?!
LMAO!