Predicting Wisconsin’s Economic Future
Two commentators fiercely disagree as to whether Wisconsin has turned the corner. Who’s right?
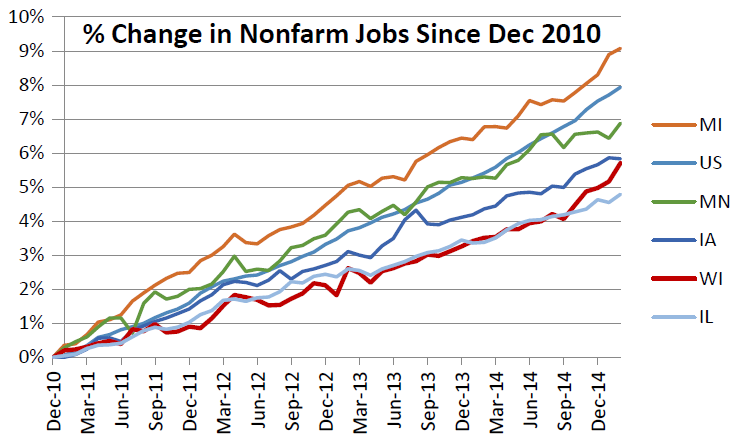
% Change in Nonfarm Jobs Since Dec 2010
For the past four years Wisconsin has been stuck around 37th place among the states in job growth. A recent opinion piece by retired business exec Thomas Hefty in the Journal-Sentinel argues this pattern is about to change. A week later, UW-Milwaukee researcher Marc Levine countered with a JS opinion piece of his own, blasting Hefty’s conclusion. Who is right? Is Wisconsin on the upswing? Let’s consider the data.
The U.S. Bureau of Labor Statistics issues three sets of job estimates. The first two are usually issued towards the end of the month following the month which is being estimated. The preliminary figures are revised in the next month, often radically, so that initial figures showing job growth turn into job shrinkage and vice versa.
The first of these is a monthly survey of a sample of business establishments, used to estimate the number of nonfarm jobs. The chart to the right shows the percentage change in jobs since Scott Walker became governor, for Wisconsin, its neighbor states and the nation, taken from this survey.
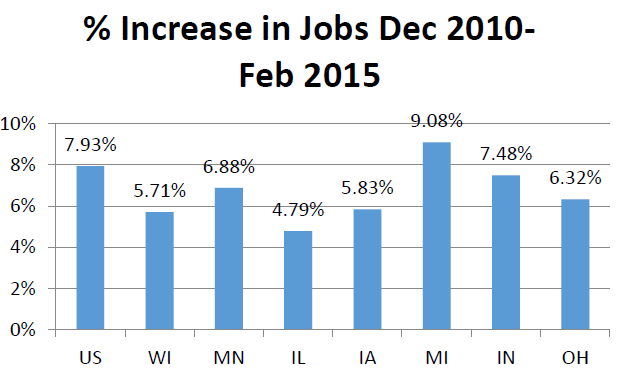
% Increase in Jobs Dec 2010-
Feb 2015
During much of this period, Wisconsin and Illinois have run neck and neck for the lowest job growth in the upper Midwest. However, starting last fall, Wisconsin experienced somewhat higher growth, opening a gap with Illinois. In his article Hefty seems to take note of this. The governor, no slouch at self-promotion, has also called attention to the apparent improvement in the past few job reports.
The next chart shows the percentage change of all jobs among these states plus two other industrial Great Lakes states, Ohio and Indiana. Wisconsin is no longer at the very bottom, but still trails the country and still trails five of six midwest states. The data in this chart comes from a monthly survey of households, done by the Census Bureau. It is used to estimate the unemployment rate. However, it also results in an estimate of employment. The results can vary from the earlier survey of business establishments. For example, the survey of households counts farm employment even if uncompensated.
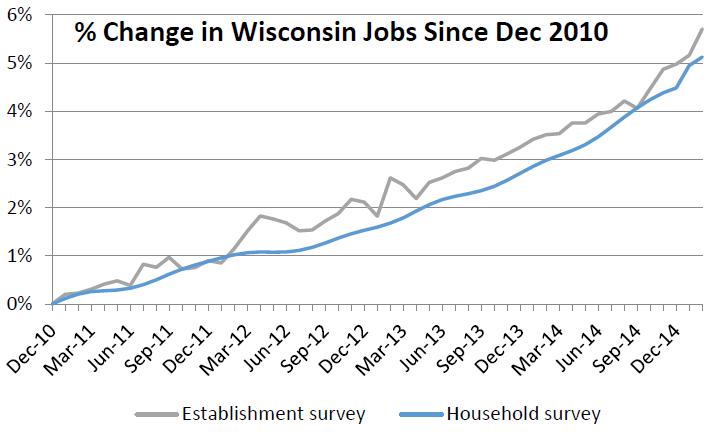
% Change in Wisconsin Jobs Since Dec 2010
However, over time, the two surveys might be expected to follow roughly similar trajectories. The chart to the right compares the two over time for Wisconsin. The apparent recent uptick in jobs seems much less evident in the second, suggesting sampling error rather than a real change.
Several months later a third estimate appears, the quarterly survey of employment. It is considered by far the most accurate picture of employment, covering far more establishments than the monthly survey. Unfortunately, it is released with a lag time of about six months–the most recent release runs only through last September. This means we will have to wait another three months before it will shed light on whether the recent apparent uptick is real or represents sampling variability.
All such surveys show what has already happened; not what is likely to happen. This limitation has led to a search for some indicator that predicts future job performance. Hefty suggests four possibilities: the Manpower Employment Outlook survey, Gallup’s Job Creation Index, The Paychex/IHS Small Business Jobs Index, and the MoneyTree quarterly report on venture capital investment and concludes that all four show progress in Wisconsin. A fifth, not mentioned by Hefty, the Leading Index from the Philadelphia Fed, has also been used to predict Wisconsin’s economic performance.

Wisconsin according to Phila Fed
The Philadelphia Fed’s Leading Index. The Philadelphia Federal Reserve publishes “coincident” and “leading” indices for the states. The coincident index is based on nonfarm payroll employment, average hours worked in manufacturing, the unemployment rate, and wage and salary disbursements. It is meant to match changes in the state GDP.
Its leading index for each state predicts the six-month growth rate of the state’s coincident index, according to the Philadelphia Fed. As the plot to the right shows, the leading index is far more volatile than the coincident index. This means that depending on the month Wisconsin’s leading index may be near the best or near the bottom. Last spring when Wisconsin, had risen to 12th place this was celebrated by supporters of Walker’s policies. In January Wisconsin had dropped to 39th.
In the past, advocates on either side have jumped on the leading index whenever it seems to predict an imminent boom or imminent bust. Perhaps having been burned by its volatility, it appears that it has lost its popularity among the advocates.
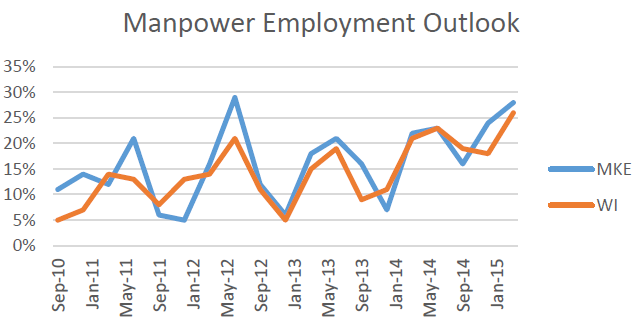
Manpower Employment Outlook
The Manpower Employment Outlook survey. Every three months Manpower surveys a sample of employers and asks whether they expect to increase, decrease or keep employment the same. It then derives employment outlook indices for states and metropolitan areas by subtracting the percentage of employers expecting to decrease employees from the percentage planning to hire more workers.
In its latest quarterly report, Manpower headlined Wisconsin’s outlook as “Among strongest in nation,” leading Hefty to conclude Wisconsin was about to see a breakthrough. However, Wisconsin employers have been remarkably upbeat in their reports to Manpower over the past four years. The chart on the right shows the results for Wisconsin and the Milwaukee metropolitan area since September 2010. Throughout, reported gainers have always led losers, usually by a comfortable margin on the surveys. The rosy viewpoint is supported by the terms Manpower used in its reports on Wisconsin and metro Milwaukee: Strong (4 appearances), positive (twice), healthy, booming, solid, robust, favorable, optimistic, confident, and among strongest in nation (twice). The sub-sample of Milwaukee-area employers is even more bullish on employment leading to Manpower describing the Milwaukee area as the strongest in the nation back in 2010, and in four Walker-era quarters.
Yet, during much of this period, Wisconsin’s actual job growth lagged that of most of its neighbors. What explains the discrepancy? Levine’s critique focuses on the mismatch between the rosy Manpower surveys versus mediocre subsequent job growth. One possible explanation for the mismatch is sampling bias: perhaps the sample of employers used by Manpower was doing more hiring than the average Wisconsin company. Another is political bias: perhaps Wisconsin businesses’ strong support for Walker’s policies colored their reporting.
Gallup Job Creation Index. As part of its daily tracking poll the Gallup organization asks workers whether their employers are hiring and expanding the size of their workforce, not making changes, or reducing their workforce. Like Manpower, Gallup’s index is calculated by subtracting the percentage reducing employment from the percentage increasing employment. Based on poling throughout 2014, Gallup ranked Wisconsin 4th.
How well does Gallup’s survey predict future hiring? To get an idea, I used regression analysis to test how well the state-by-state job growth figures for 2014 could be explained by two factors: the Gallup results from its 2013 survey and that state’s actual percentage job growth in 2013. The result: the 2013 job growth was useful in predicting 2014 job growth. By contrast, the Gallup job growth index failed to improve the model (for statistics buffs, it had a p-value of .79), meaning it had little value in predicting future job growth.
A third index Hefty points to is put out by Paychex, the payroll processing firm, of employment in small businesses. Its most recent report rates Wisconsin as 4th among the states. Paychex has rated Wisconsin highly for some time. The Paychex monthly archive goes back to last March, which put Wisconsin as 3rd. In October Wisconsin was 1st before sinking to 4th. It seems likely that the jobs counted by Paychex are already included in Wisconsin’s monthly job reports.
Although Paychex and Gallup agree when it comes to Wisconsin, in other cases they come to opposite conclusions. Paychex puts Washington DC at the bottom of major cities when it comes to small business job growth, yet DC tops Gallup’s state ratings.

MoneyTree venture capital index
The MoneyTree venture capital index. Hefty refers to the “MoneyTree” report from Price Waterhouse Cooper and the National Venture Capital Association, with data by state for the amount of venture capital. The graph to the right shows the amount of venture capital raised per resident of each state for the last two quarters of 2014. California is far in the lead by volume but falls to second place to Massachusetts on a per capita basis. Wisconsin is shown with a red dot. Particularly with the smaller states there is considerable fluctuation from one year to the next, depending on whether there was a really big deal signed. But looking more long term, Wisconsin continues to do poorly in raising venture capital.
What does all this tell us? Surveys of employers don’t seem to be good predictors of future employment. Bureau of Labor Statistics results are much more reliable, and so far show Wisconsin doing poorly compared to most states, but the bureau’s best data lags behind and can only tell us how we were doing up to six months ago. Those who make claims based on more recent data should be suspect.
Data Wonk
-
Scott Walker’s Misleading Use of Job Data
 Apr 3rd, 2024 by Bruce Thompson
-
How Partisan Divide on Education Hurts State
 Mar 27th, 2024 by Bruce Thompson
-
Will Wisconsin Supreme Court Legalize Absentee Ballot Boxes?
 Mar 20th, 2024 by Bruce Thompson


Other measures would be annual average and median salaries, and mix of jobs. A successful regional economy has always relied on a mix of 1/3 production to support the 2/3 of the service sector. Production jobs would be manufacturing that sells outside the region and bring in money, in state energy production, universities, agriculture, food processing, military, trucking, etc. as compared to retail, health, localized construction and banking, local government, etc.
WI sends over 13 Billon annually to import energy. WI has a 17 Billion annual tourism industry that brings in money. These are other factors in a successful economy and could be added to the discussion.