Walker Decision on Obamacare Is Costly
New numbers allow for analysis of Affordable Care Act’s impact nationally and in Wisconsin.
The major provisions in the Affordable Care Act (Obamacare) kicked in at the beginning of this year. Although a full accounting of results won’t be available for several years, preliminary numbers are revealing.
In its decision upholding most of the ACA the Supreme Court made the expansion of Medicaid voluntary. About half the states chose to expand Medicaid, mainly states with Democratic governors. The others decided not to expand it. For convenience, I will refer to the first group as “blue” states and the latter as “red” states, although the divide does not perfectly follow party lines.
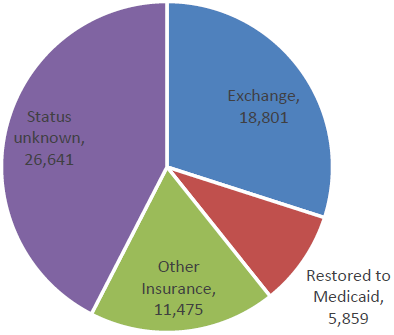
Breakdown of how the 62,000 people who were dropped from Medicaid obtained health insurance.
Wisconsin is a bit of an anomaly. To quote Gov. Scott Walker’s economic plan, Wisconsin is “the only state in the nation with no health coverage gap that didn’t accept the ObamaCare Medicaid expansion.” It did this by dropping about 62,000 people from Medicaid–generally parents—with incomes above the poverty level. This made space for other Wisconsin residents—people without children earning less than the poverty level—to enroll in Medicaid (called “BadgerCare Plus” in Wisconsin).
It appears the policy was designed to be a wash: the new enrollees would fill slots opened by those being dropped. Despite the removal of parents, overall BadgerCare enrollment has increased by about 55,000 from March to October.
Those dropped from Medicaid were encouraged to find insurance through the federal exchange. As the pie chart shows, about a third did. Another third either found other insurance or were restored to Medicaid, leaving 26,641 whose current health insurance status is unknown.
Theoretically, some of those missing people could have purchased private health care insurance, but it seems unlikely a large number could have afforded the monthly premiums. Even with the tax credits, insurance bought through the exchange costs more than the Medicaid (with no monthly fee or co-payments) those people were getting. In Milwaukee County, for example, a 50-year old making $12,000, slightly over the poverty line, will find that the tax credit completely covers the monthly premium of the lowest cost “silver” plan, but has estimated out-of-pocket costs of $2,250 per /year. Other plans offer lower estimated out-of-pocket costs, but higher premiums.
There are anecdotal reports of Medicaid recipients finding it hard to find providers in Wisconsin but no comprehensive study, so far as I can find. A recent New York Times article, Shortage of Medicaid Doctors? Not if You Ask Patients, summarized research that found that 97 percent of Medicaid recipients reported they were able to make an appointment with a provider. There are also complaints that some private plans hold down costs by using narrow networks of providers.
When all is said and done will the percentage of residents without health insurance in Wisconsin look more like that in a red state or in a blue state? Even before the ACA kicked in, states expanding Medicaid already had lower rates of uninsured people than those who chose not to: 14.9 percent versus 18.2 percent according to a New York Times analysis. They also saw bigger drops—to 9.2 percent versus 13.8 percent. (Other studies found somewhat different numbers, although the general direction is the same. Gallup, based on its polling, estimated the percentage of uninsured in states both expanding Medicaid and setting up their own exchange dropped from 16.1 percent to 12.1 percent while in the remaining states that dropped from 18.7 percent to 16.5 percent.)
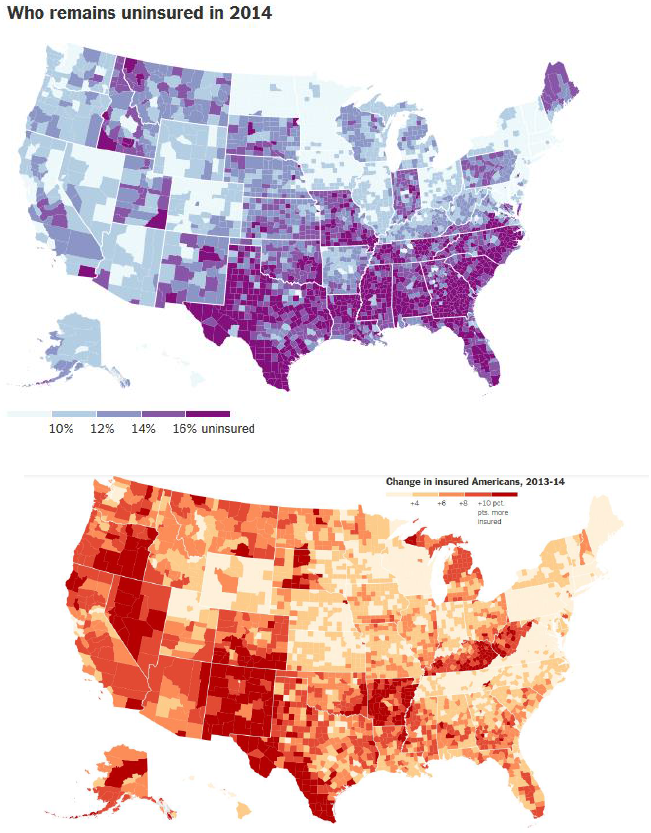
Who remains uninsured in 2014.
The Times estimated the before and after percentages by county, not state, but the interactive maps still show the effect of state policies. The first Times map shows the estimated percentage of people who were still uninsured in 2014. The darker the color, the more people without health insurance. For example, there is a stark difference between Arkansas and Kentucky, which expanded Medicaid, and other southern states, which did not. Likewise, it is easy to see on the map where Wisconsin ends and Minnesota begins.
A similar pattern is apparent in the next map, showing the decline in the percentage uninsured. The smaller the decline the lighter the color. Wisconsin counties saw a smaller decline compared to those in neighboring states.
Using the county numbers from the Times, I calculate the number of uninsured dropped 15 percent in the four-county Milwaukee metropolitan area compared to 27 percent in the 5-county region around the Twin Cities.
It should be stressed that these enrollment estimates are preliminary and based on samples, and likely to change as the program matures. Samples are particularly subject to error with states, like Minnesota and Wisconsin, where the percentage of uninsured people was lower to start with. Keeping these caveats in mind, early evidence suggests that expanding Medicaid would have been more effective in reducing the number of Wisconsin residents without insurance.
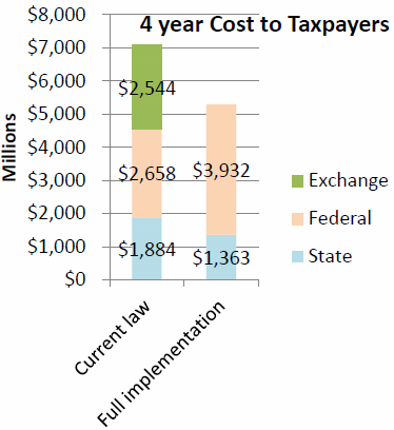
4 Year Cost to Taxpayers.
The second element of a benefit-cost analysis is the cost to taxpayers. According to the MacIver Institute, “by rejecting the expansion, taxpayers will save up to $752 million through fiscal year 2017 according to the Legislative Fiscal Bureau.” This claim is puzzling, because the document referenced by MacIver estimated that rejecting the expansion cost Wisconsin taxpayers $521 million over the same four-year period. How did MacIver turn a $521 million taxpayer savings into a $752 million taxpayer increase? MacIver did not respond to a request for explanation. However, $752 million corresponds to the amount one would get by adding federal costs to state amounts and taking the difference. This chart shows the LFB’s comparison of the total 4-year cost to state and federal cost of expanding Medicaid.
Putting the state and federal share of the Medicaid and exchange cost together, the total 4-year cost to state and federal taxpayers with current Wisconsin law rises to around $7 billion for full implementation of the law, compared to a little over $5 billion for full expansion of Medicaid. That’s a huge difference — more than $2 billion over four years.
In judging public policy decisions, a benefit-cost ratio is often used. The benefits of the decision—the number of Wisconsin residents with health insurance—is divided by the cost to taxpayers. In the case of the decision to not expand Medicaid, the benefits are lower while the cost to taxpayers—whether state or federal—is higher.
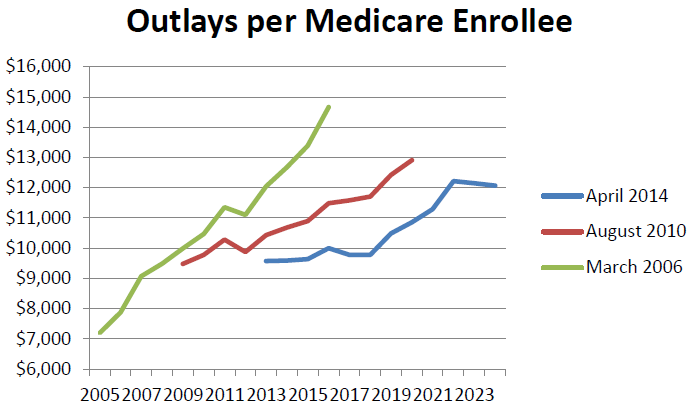
Outlays per Medicare Enrollee.
When Walker decided to not expand Medicaid, he raised the specter that the federal government would renege on its promise to pay 100 percent of the costs, dropping to 90 percent in the future. How likely is this? Critics have pointed out that this has never happened with past commitments to Medicaid funding.
One possibility is that rising medical costs make the commitment unsustainable. This argument runs up against the recent moderation of the medical cost trend. As an example, look at what has happened over time to the estimates from the Congressional Budget Office of future Medicare costs. In its March 2006 report CBO estimated the 2016 cost per enrollee would be $14,663. In August 2010, this had dropped to $11,484. In the most recent report it dropped further, to $10,000.

Federal Surplus as % of GDP.
A second argument is that the federal budget deficit will make the promised federal cost-sharing unsustainable. The next chart shows the historical federal deficit (shown as a negative number) as a percentage of the US gross domestic product (GDP) followed by the CBO’s estimates of future deficits. After a sharp rise due to the recession, the deficit is projected to return to 2.9 percent of GDP, slightly below its historical level.
If the federal government does renege on its promise, the likely cause will be political, not financial.
Data Wonk
-
Was Wisconsin’s Presidential Primary a ‘Huge Success’ For Trump?
 Apr 10th, 2024 by Bruce Thompson
-
Scott Walker’s Misleading Use of Job Data
 Apr 3rd, 2024 by Bruce Thompson
-
How Partisan Divide on Education Hurts State
 Mar 27th, 2024 by Bruce Thompson