What Makes State a Unique Primary
Big turnout and strong manufacturing economy among many factors that make it unique challenge for candidates.
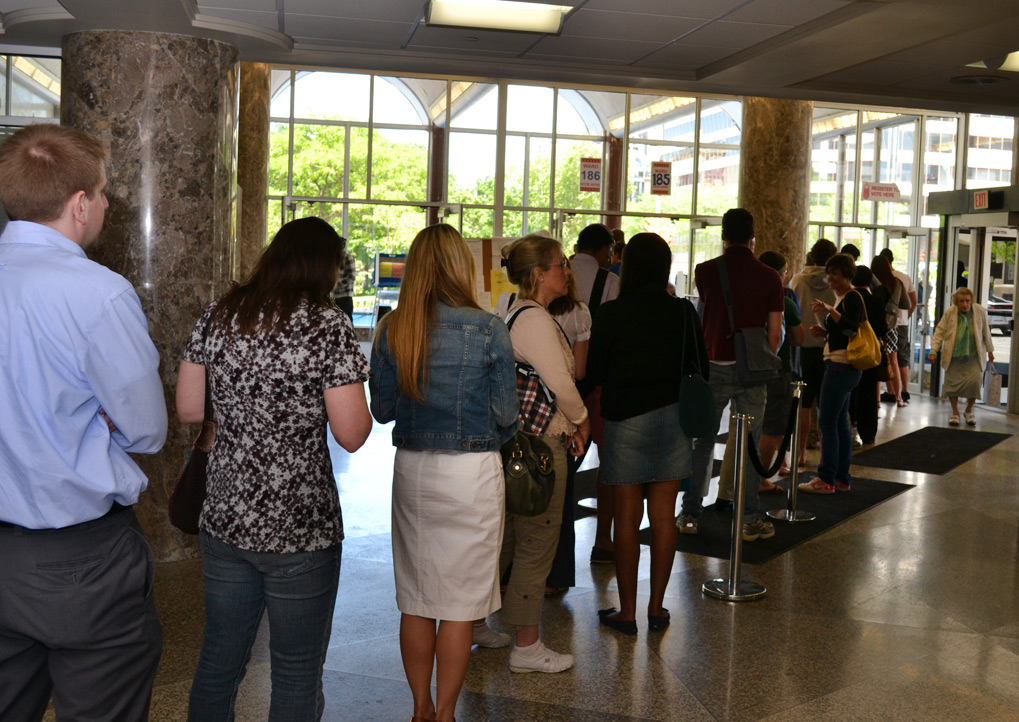
Voting Line
National attention turns to Wisconsin this week because the Badger State’s presidential primary on April 5th is the only one between now and April 9 (the Wyoming caucus). For those who are trying to understand some of the demographic and economic context for the April 5th election, we’ve pulled together a variety of facts about Wisconsin and how it compares to other states.
Demographics
- Population size and voting
- Wisconsin’s population – 5.77 million in 2015 – was 20th largest last year.
- Voter turnout on April 5 is expected to be about 40% of the state’s 4.4 million eligible voters (compared to just 15.7 % in Iowa[i]), thanks in part to the fact that it’s also the general election date for a Wisconsin Supreme Court seat and for local elected officials – with 5,891 candidates competing for 3,888 offices across the state.
- Racial diversity
- Wisconsin is a very white state – 82.2% in 2014 (excluding Hispanics and Latinos), compared to 62.1% nationally.[ii]
- Only about 6.6% of Wisconsinites are Black, which is one half the national average in 2014 of 13.2%.[iii]
- Just 6.5% of Wisconsinites are Hispanic or Latino, compared to 17.4% for all states in 2014.[iv]
- Wisconsin is home to 11 federally recognized American Indian tribes and bands, and in 2014 there were about 50,700 American Indians in Wisconsin (0.9% of the state population, which was 18th nationally).[v]
- The racial and ethnic composition is significantly different among younger Wisconsinites. For example, Hispanics comprised 11.3% of Wisconsin children in 2014, compared to only 5.0% of Wisconsin adults.
- Racial and ethnic disparities
- Wisconsin leads the nation in having the largest disparities between White children and African American children. For example, a composite score based on 12 indicators of child well-being found that Wisconsin ranked last among Black children, yet 10th best for White children.[vi]
- Wisconsin had the 2nd highest residential housing segregation for Blacks and Whites in 2010, second only to Montana.[vii]
- Immigrants
- Only 4.7% of Wisconsinites are foreign-born, versus 13.1% nationally.[viii]
- Although immigrants are a relatively small part of the Wisconsin population, their numbers have been growing rapidly, and it is estimated more than 40% of hired workers on dairy farms are immigrants.[ix]
- Wisconsin’s Hmong population (a little over 47,000 in 2010), is the third largest in the U.S., and in terms of percentage of the state population (0.8%) is second nationally, behind only Minnesota.
- Elderly population
- Education
- Poverty
- The number of Wisconsin children living in poverty has grown substantially (an increase of 48,000 from 2007 to 2014[xiv]), but the percentage in poverty in Wisconsin, 18.4%, was still significantly below the national average of 21.7% in 2014.
Economy
- Job growth
- Wisconsin was 36th in job growth over the past 12 months, according to the latest Quarterly Census on Employment and Wages (QCEW), with a growth rate that was only about half the national average (a 1.2% increase in private sector jobs in Wisconsin vs. 2.2% nationally),[xv] and the QCEW data also show that Wisconsin has trailed all the other states in the upper Midwest from September 2011 through September 2015.
- Income levels and income inequality
- Per capita income of workers is a little less than the national average in Wisconsin – 2.3% below the national average from 2010 through 2014.
- On the other hand, median family income was 1.9% above average in Wisconsin in 2014, according to the Census Bureau ($67,187 in Wisconsin vs. $65,910 nationally).[xvi]
- Wisconsin has historically had significantly less income inequality than other states, but has slowly been catching up. Between 1979 and 2012, the average income of the top 1% in Wisconsin grew by 149%, while the average income of the remaining 99% grew by only 1%.[xvii]
- Reliance on manufacturing
- Wisconsin ranks 2nd highest in the percentage of the workforce in manufacturing – slightly behind Indiana, but well above the other 48 states. (Manufacturing jobs account for 16.2% of non-farm jobs in WI in Jan. 2016, compared to 8.6% nationally.)
- Wisconsin’s lead in manufacturing has been slipping a little. Among the 10 states with the highest percentage of jobs in manufacturing, Wisconsin was 6th in the percentage growth of manufacturing jobs from December 2010 through January 2016.[xviii]
- Unemployment rate
- Wisconsin’s unemployment rate in January 2016 was 4.6%, compared to 4.9% nationally.
- The Wisconsin unemployment rate has long been well below the national rate, but this chart from the state’s Job Center shows the difference has been shrinking.
- Labor force participation rate
- Wisconsin has long had a high proportion of adults in the workforce, and ranked 7th highest in 2014 (with 78.8% of people 16-64 in the workforce, compared to 73.6% nationally).
[i] United States Election Project, 2016 Presidential Nomination Contest Turnout Rates
[ii] This is the white alone, non-Hispanic and non-Latino rate in 2014, from the U.S. Census Bureau QuickFacts.
[iii] From the American Community Survey (ACS) 5-year average for 2010-2014
[iv] From the American Community Survey (ACS) for 2014.
[v] These figures are for those who identify as American Indian (or Alaska native) alone; it excludes those of two or more races. The figures come from American Community Survey table R0203 for 2014.
[vi] Race for Results, Wisconsin Council on Children and Families, Fall 2014.
[vii] Analysis of 2010 Census data by the Stanford Center on Poverty and Inequality, 2015 State of the States http://inequality.stanford.edu/sites/default/files/SOTU_2015.pdf
[viii] From the U.S. Census Bureau QuickFacts, based on 2010-14 averages.
[ix] http://www.jsonline.com/business/wisconsin-dairy-farmers-worry-about-impact-of-a-day-without-latinos-rally-b99671884z1-369128961.html
[x] From the U.S. Census Bureau QuickFacts, based on2014 data.
[xi] http://www.worldatlas.com/articles/the-us-states-with-the-oldest-population.html
[xii] From the U.S. Census Bureau QuickFacts, based on 2010-14 averages.
[xiii] Ibid
[xiv] http://www.wccf.org/number-of-child-in-poverty-in-wisconsin-stays-high/
[xv] http://www.jsonline.com/business/wisconsins-pace-of-job-growth-continues-to-trail-behind-the-national-average-b99684291z1-371523701.html
[xvi] American Community Survey 2014 table R1902
[xvii] http://www.wisconsinbudgetproject.org/income-inequality-in-wisconsin-reaches-record-levels
[xviii] From a March 2016 Wisconsin Budget Project analysis of Bureau of Labor Statistics data.
Wisconsin Budget
-
Charting The Racial Disparities In State’s Prisons
 Nov 28th, 2021 by Tamarine Cornelius
-
State’s $1 Billion Tax Cut Leaves Out 49% of Taxpayers
 Sep 21st, 2021 by Tamarine Cornelius
-
TANF Program Serves a Fraction of Poor Families
 Aug 30th, 2021 by Jon Peacock