
Who Gets Biggest Piece of the Pie?
Five pie charts show the increase in inequality and poverty in Wisconsin.

Jon and Tamarine celebrate Pi Day. Mmmmm…strawberry rhubarb! Photo courtesy of the Wisconsin Budget Project.
Happy Pi Day! Today’s date is 3-14, a close approximation of the pi value of 3.141592…
The best way to celebrate Pi Day is – news flash! – to eat some pie.
The second best way of observing Pi Day is to enjoy some delicious pie charts. Sure, pie charts don’t go as well with ice cream as the real thing, but they’re still enjoyable.
Here are five pie charts that tell the story of poverty and economic hardship in Wisconsin, and how the share of the pie that goes to the middle class is shrinking.
Pie Chart #1: Highest earners capture nearly all of the income growth in Wisconsin
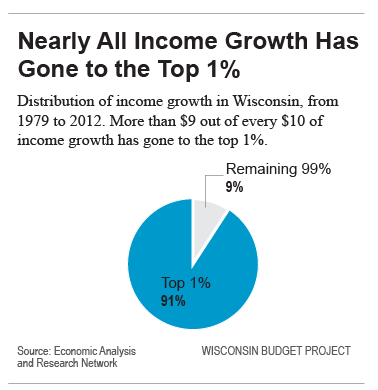
Nearly All Income Growth Has Gone to the Top 1%
Wisconsin families and businesses can’t thrive when income growth is nearly non-existent for everyone except for those at the very top. The share of income in Wisconsin going to the top 1% is at its highest level ever, widening the chasm between the very highest earners and everyone else, and posing a hardship for Wisconsin’s families, communities, and businesses.
Pie Chart #2: Jobs that pay family-supporting wages are disappearing, and being replaced by jobs that pay much less
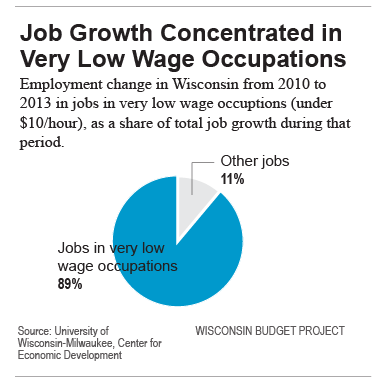
Job Growth Concentrated in Very Low Wage Occupations
Most of the job growth in Wisconsin and elsewhere has been among jobs that don’t pay very much. That trend makes it hard for people to work their way out of poverty and to support their families.
Pie Chart #3: Working isn’t always enough to lift people out of poverty
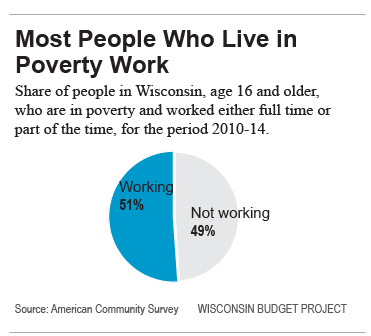
Most People Who Live in Poverty Work
More than half of Wisconsin adults in poverty worked, but didn’t earn enough money to pull themselves out of poverty.
Pie Chart #4: Most black children in Wisconsin live in poverty
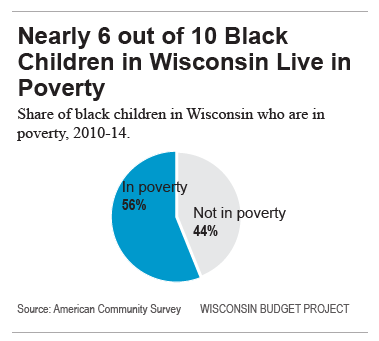
Nearly 6 out of 10 Black Children in Wisconsin Live in Poverty
The loss of jobs that pay family-supporting wages has hit black families in Wisconsin particularly hard. Nearly six out of ten black children in Wisconsin live in poverty, and they are five times as likely to be poor as white children in Wisconsin. Living in poverty makes it harder for children to grow up and become healthy, well-educated members of our future workforce.
Pie Chart #5: Increasing the minimum wage could give an economic boost to many families
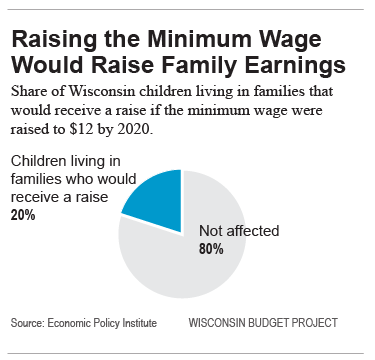
Raising the Minimum Wage Would Raise Family Earnings
Raising the minimum wage won’t solve all our economic problems, but it would give a raise to many families who are struggling to make ends meet. Increasing the minimum wage to $12 an hour would raise the family incomes for 1 in 5 Wisconsin children, or more than a quarter of a million children across the state.
Wisconsin Budget
-
Charting The Racial Disparities In State’s Prisons
 Nov 28th, 2021 by Tamarine Cornelius
-
State’s $1 Billion Tax Cut Leaves Out 49% of Taxpayers
 Sep 21st, 2021 by Tamarine Cornelius
-
TANF Program Serves a Fraction of Poor Families
 Aug 30th, 2021 by Jon Peacock


Lol “close approximation” … it’s 3 digits of an infinite constant. That’s a little inexact.
Nearly unfathomable how much wealth growth had gone to the wealthiest percentage.
While perhaps technically and linguistically correct:
http://www.merriam-webster.com/dictionary/most
http://www.merriam-webster.com/dictionary/majority
Pie Chart #3 should not be accompanied with the word “most”.
The word “most” implies a value greater than 51%
Especially if membership in the 49% category means people performing exactly zero hours of work.
Where’s the chart that shows how much the 1% pay in taxes? Why are the charts from varying years? Specifically, why are the charts that perpetuate bad news only based on the time at which the economy was at a recent historical low? I understand that there may be a lag in obtaining figures but the entire presentation smells of cherry-picking.
This is the way that it has been all across the country the last 8 years, under Obama. His policies have helped the rich. Wisconsin can really do little to encourage growth but can chase growth out as Doyle did, it has happened across the country. Jobs are going south cause the crazy left has chased them out, Like Kimberly Clarke. If I had a business that could move, I would have been gone asap.
So Obama is to blame for explosion of 1% over last generation and Doyle, who left office over 6 years ago before much of economic recovery is responsible for Wisconsin’s poor performance ever since? I think you need to check into a nursing home, Bob. You’re probably a danger to the public. I hope they’ve taken your keys away.
Are these really Wisconsin problems? Income growth going to the top 1% is a nationwide problem. And as we’re seeing in the presidential primary, even Democrats can’t be bothered to select the only candidate willing to do anything about it.