On The Road to Serfdom?
Paul Ryan and others argue U.S. spending and government control is increasing. What does the data show?

Paul Ryan
Fundamental to the belief system of many of those attracted to the Tea Party is the belief that small government translates into personal freedom. What does the empirical evidence tell us about this connection?
Those believing that freedom depends on small government sometimes refer to Friedrich Hayek’s The Road to Serfdom. Hayek wrote the book in 1944 as a warning to Britain against central planning. The book became hugely popular in the United States, including an abridged version from the Reader’s Digest and even a comic book.
In an interview, Wisconsin Congressman Paul Ryan was quoted as saying that he handed a copy of Hayek’s book to every new staffer so they can understand Ryan’s thinking. One might wonder whether Ryan’s new hires actually read the book. If so, they might come across sections like the following that should give pause to a modern American conservative:
“Nor is there any reason why the state should not assist the individuals in providing for those common hazards of life against which, because of their uncertainty, few individuals can make adequate provision. Where, as in the case of sickness and accident, neither the desire to avoid such calamities nor the efforts to overcome their consequences are as a rule weakened by the provision of assistance – where, in short, we deal with genuinely insurable risks – the case for the state’s helping to organize a comprehensive system of social insurance is very strong.”
If they did read the book they would see that Hayek’s concern was much more about central planning than about government social expenditures:
“In any case, the very necessary effort to secure protection against these fluctuations do not lead to the kind of planning which constitutes such a threat to our freedom.”
In 1944, when Hayek was writing, both Nazi Germany and the Soviet Union were exemplars of central planning. In part because of the apparent success of those regimes, central planning intrigued many in the west. In the following 70 years history has been very different than Hayek predicted. Centrally planned regimes have dwindled to a few sad remnants, notably North Korea and Cuba.
What remains of the Road to Serfdom is not its substance but its title. Any new government program is described as putting us on the “road to serfdom.”
- A post on Right Wisconsin, a website described as “powered by Charlie Sykes,” is entitled “A Quiet Reminder on the Road to Serfdom.” It accuses the Obama administration of deliberately making the 2013 federal government shutdown more painful.
- Last month the Heartland Institute published an article arguing that America is “still on F.A. Hayek’s Road to Serfdom. As evidence, it points to FDA regulations, zoning rules, social security, taxes, passports, and the minimum wage, among others.
- A post in something called American Thinker from last year argues that “Property Taxes Pave the Road to Serfdom”
- A headline on a post at the Heritage Foundation stated, “America Treading Down Road to Serfdom with Big Spending.”
- In the conservative blogosphere, Obamacare is often described as leading down the road to serfdom.
The road to serfdom panic is based on the combination of two beliefs: that the size and scope of government has been growing and that a larger government is a threat to freedom. Promoting the first belief, the Heritage Foundation’s web site states: “Over the past 20 years, [federal] spending has grown 63 percent faster than inflation.” This statement depends on the reader forgetting that the US economy has also grown during the past two decades. In fact, federal spending as a percentage of Gross Domestic Product (GDP) is almost the same as it was 20 years ago (20.1 percent in 2014 versus 20 percent in 1994).

Federal Net Outlays as Percent of GDP
The chart to the right shows federal net outlays as a percentage of GDP since 1929. They grew during the Depression, peaked at 40 percent in World War II before falling at the war’s end. They then inched up during the post-war years, peaking at 22.3 percent in the early 1980s. They then leveled off, declined during the Clinton boom years, peaked again in the Great Recession, and have since been dropping. Even if one believed that expanding government was a threat to liberty it’s hard to see why this is a time to panic.
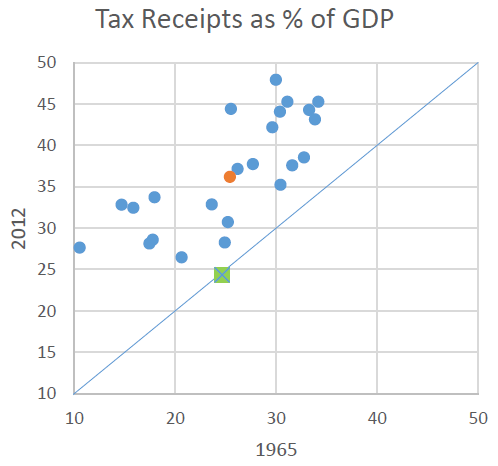
Tax Receipts as % of GDP
How does the growth of government in the U.S. compare to other nations? I looked at data from the Organization for Cooperation and Development (OECD) on tax revenues as a percentage of gross domestic product (GDP) going back to 1965. I eliminated countries that weren’t members of OECD in 1965 (mostly former eastern bloc countries). The chart to the right compares the percentages in 2012 (in a few cases 2011) with those in 1965. The average is shown as a red dot. The line shows where countries would fall if their percentages had remained unchanged.
All the nations but one fall above the line, meaning they increased their percentage of GDP that went to taxes. The one exception is the U.S., shown as a green square, where tax receipts as a percent of GDP is the same as it was in 1965. It’s ironic: the Tea Party panic about government expansion is concentrated in the one country that has seen the least expansion. (Fear of the unknown, perhaps?)
The question, then, is what happened to freedom in the other countries, whose government proportion of GDP increased? Was their increased government spending accompanied by less freedom? To get an idea of the answer, I turned to rankings from Freedom House.
Every year, Freedom House issues a report rating countries for both political rights and civil liberties on a scale of 1 to 7 where 1 is free and 7 is not free. Countries with a rating of 1 in political rights:
Enjoy a wide range of political rights, including free and fair elections. Candidates who are elected actually rule, political parties are competitive, the opposition plays an important role and enjoys real power, and the interests of minority groups are well represented in politics and government.
Countries with a rating of a 1 in civil liberties:
Enjoy a wide range of civil liberties, including freedoms of expression, assembly, association, education, and religion. They have an established and generally fair legal system that ensures the rule of law (including an independent judiciary), allow free economic activity, and tend to strive for equality of opportunity for everyone, including women and minority groups.
All of the OECD countries shown in the chart above earned top scores from Freedom House in both political rights and civil liberties, with two exceptions, Greece and Turkey, on the most recent evaluations. Looking at all the countries in the world, the OECD countries stand out. They have strong democratic traditions and modern economies. Unfortunately they are not typical. An awful lot of countries are run by despots and have miserable economies. Is there a connection between the two?
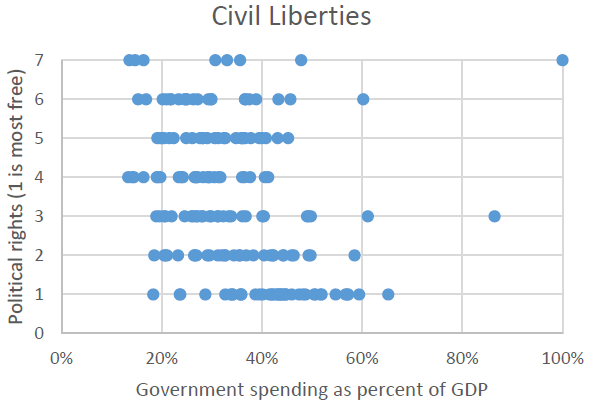
Civil Liberties
The charts to the right plot the Freedom House rankings against government spending as a percentage of GDP for most of the nations on the earth. The government spending figures are taken from a publication from the conservative Heritage Foundation describing how it rates countries for “economic freedom.”
The quick takeaway is that there is no evident connection between freedom and government spending. (If there was you’d see a concentration in the far upper right hand area of the the graph, for countries with high government spending and low freedom.) Some countries with low spending do well on freedom, but others do very poorly. Some countries with high government spending do well on freedom, but others don’t.
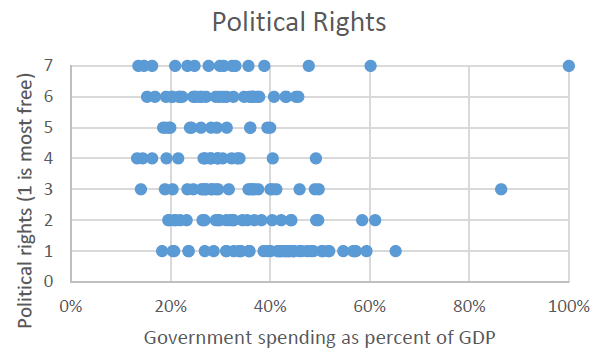
Political Rights
Inadvertently, the Heritage Foundation’s country ratings support this conclusion. It publishes an “Economic Freedom Heat Map” whose top scorer is Hong Kong, followed by Singapore. But Hong Kong is rated “partly free” by Freedom House, with a score of 5 political rights, reflecting the lack of free elections. And Singapore is given low marks — a four — for both political rights and civil liberties. Another country scored high by Heritage is Bahrain, which Freedom House rates as “not free.”
These are exceptions. Most of the countries rated highly by Heritage also score well with Freedom House. The upshot, however, is that Heritage is perfectly happy with despots so long as they respect property rights, keep corruption under control, offer low top marginal tax rates, minimize the total tax burden, limit government spending, and offer “labor freedom,” including a low minimum wage if any.
Freedom House found an overall drop in freedom for the ninth consecutive year in 2014, with almost twice as many countries suffering declines as registering gains. The Journal of Democracy devoted its January issue to essays exploring the reasons for this decline. One factor suggested was the increased economic dominance by China in many countries, particularly in Africa. The China model suggested that an authoritarian regime could create a dynamic economy without suffering the pains of giving political freedom to its citizens.
Freedom is under attack in many parts of the world today. In these places champions of freedom risk their lives and personal freedom. By attaching the word “freedom” to an economic agenda that has little to do with freedom, organizations like the Heritage Foundation — and politicians who echo its political line — not only trivialize the sacrifices being made, but make serious discussion of economic policy less likely.
Data Wonk
-
Scott Walker’s Misleading Use of Job Data
 Apr 3rd, 2024 by Bruce Thompson
-
How Partisan Divide on Education Hurts State
 Mar 27th, 2024 by Bruce Thompson
-
Will Wisconsin Supreme Court Legalize Absentee Ballot Boxes?
 Mar 20th, 2024 by Bruce Thompson


I think your numbers are wrong on government spending as a % of GDP. I would recheck those, it is much higher than you say as a % of GDP. National debt has gone from $10 trillion to $17 trillion since 2008 to finance spending we can’t pay for. Before people start yelling at me, I think both parties are guilty. Interesting article but have to disagree with the conclusions.
So are we on the road to serfdom Allison? Already there?
@Allison here is the link to the same chart from the St. Louis Fed: http://research.stlouisfed.org/fred2/series/FYONGDA188S
If you don’t believe the chart, it may be because you are conflating separate measures. Just because $17 trillion (no $18) sounds like a big number doesn’t mean anything divorced from context.
PMD-I hope we are not on the road to serfdom, but maybe we are already there?
I could be wrong on my numbers, but the article says Govt spending is 20.1% of GDP while Tax Receipts as a % of GDP are 25%. So shouldn’t we then be running a surplus and then why would be adding to the debt so such? Just thinking but after two wars and an economic crash I would think federal spending would have increased
I for one am very tired of rendering services to Lord Obama.
Allison,
The first figure is for federal spending only, so it does not include states and local governments.
Allison, also keep in mind that Bruce is referring to the net outlay rather than all federal government spending. The net outlay is spending minus some receipts (income) that pay for some of the governments obligations.
Bruce, if the first figure is only federal, what is the second figure? As best I can find, tax receipts for 2012 were $2.4 trillion, and GDP was $16.16 trillion. I get less than 15% with those numbers, which makes more sense with the 20% federal outlay numbers (unless there’s an $800 billion surplus hiding somewhere no one anywhere can find). So am I missing $1.5 trillion in tax revenue somewhere, or is my GDP number inflated by $6.3 trillion?
Kyle,
The OECD numbers are the combined federal, state, and local taxes.
Bruce, so you’re making your case on Federal net outlays, but all levels of government receiving taxes? Does it break your case to use total government spending in 2012, which is probably right around $6.1 trillion, or 37.75% of GDP? It’s hard to tell the exact coordinates of your red dot average point, but I’m willing to bet that if our taxation matched our spending, we’d land right about there.
http://www.usgovernmentspending.com/total_2012USrt_16rs5n
I like the discussion here (sincere searching for clarity), but I think that this subject requires an “Evening with Bruce” roundtable. I would be there and buy a beer for the first ten attendees to arrive.
I used a variety of sources for this article–OECD for total taxes as % of GDP and Heritage for govt. spending as % of GDP.. At least for the US the two closely match when it comes to taxes (24-25%). Heritage puts US government spending at 40% (not just federal), which raises the question of how the missing 16% is filled. Presumably borrowing fills a part, but that would be not nearly enough. Also fees charged by government-owned utilities would not be counted as taxes.But the gap still seems large to me.
None of this, however, affects the basic point that there is no evident effect of government size on freedom.
At least in terms of the the few rights as defined and measured by Freedom House and the Heritage Foundation.
” the basic point that there is no evident effect of government size on freedom.”
Wouldn’t a better measure, if one harder to determine, be the level of laws and regulations at federal, state, county, and municipal levels which restrict or mandate private behavior?
The extension of those regulations over my lifetime -I’m in my early 60s- would have been mind boggling if they had been imposed all at once in 1960.
Many of those may be on average beneficial: That isn’t my point. My point is that they have exploded in reach, and by increasing in complexity have become almost unknowable to many people who may be affected by them.
Arguing that restrictions on freedom are beneficial begs the point: We are in many ways less free. Whether that is good, bad, or indifferent does not matter to the issue of whether we are free or not.
In a number of important ways we are far more free than in 1950: We are free to vote in elections, no matter what our race. In most states we are far more free to legally carry a gun for self-protection (although far less free to carry one on an airplane). We are far more free to buy pornography if we are adults (although less free to buy it if we are minors), we are also far more free to buy contraceptives and to have an abortion. We are far more free to marry someone of another race or the same sex. In those examples, government power to restrict freedom has been significantly reduced without significant reduction in government expenditures. Again, it does not matter if we judge those freedoms good or bad: they are increases in freedom from government (and the counter-examples are, of course, increases in government power).
In other ways, we have far less freedom: we cannot determine for ourselves who will be allowed to eat in our restaurant, or stay at our hotel, who we will bake a wedding cake for and for whom we will not bake a wedding cake, whose wedding we will photograph, and whose we shall not, nor who we will sell a house to: Government has restricted our freedom to choose our standards for ourselves and to act upon them. It does not matter for this discussion if we think those restrictions are good or bad: they are decreases in freedom. Since those decreases have very little relationship to government spending, they don’t show up in many data sets.
Arguing that these restrictions are good or bad isn’t the point: on those issues we are far less free than we were 60 years ago. That may be a very good thing in each instance, but one cannot argue that we are more free in those areas.