Testing Walker’s Jobs Theory
He’s embraced a low-taxes approach used by other states, which has been a failure.
As my previous article reported, Wisconsin’s economy did worse under Gov. Scott Walker than in neighboring states and the US as a whole. Despite this, his policies have won him widespread support among the Republican base nationwide and a recent poll shows him leading the field of GOP presidential candidates in Iowa.
In large part this is because his policies were not invented in Wisconsin, but part of a package promoted nationwide by a wide coalition of conservative groups. The enthusiasm for Walker stems more from the aggressiveness with which he has pursued them and his success at getting them through a Republican legislature.
A recent report issued by the Wisconsin Policy Research Institute and written by the conservative Beacon Hill Institute for Public Policy lays out some of the assumptions underlying these policies while advocating that an expansion of Wisconsin’s sales tax be used to shrink the income tax:
…. income taxes, both individual and corporate, distort decisions to work, save and invest and therefore threaten a state’s ability to compete for residents and businesses. By penalizing saving and diminishing incentives to work, the income tax shrinks employment, investment, production, productivity, and future well-being.
Wisconsin is not alone in enthusiastically adopting these policies. Perhaps the best guide to states whose governors have done so is contained in a 2014 report issued by the nominally-libertarian Cato institute entitled Fiscal Policy Report Card on America’s Governors. As described in its executive summary, the report:
Examines state budget actions since 2012. It uses statistical data to grade the governors on their taxing and spending records—governors who have cut taxes and spending the most receive the highest grades, while those who have increased taxes and spending the most receive the lowest grades.
Four governors were awarded an “A” on this report card: Pat McCrory of North Carolina, Sam Brownback of Kansas, Paul LePage of Maine, and Mike Pence of Indiana. Eight governors were awarded an “F”: Mark Dayton of Minnesota, John Kitzhaber of Oregon, Jack Markell of Delaware, Jay Inslee of Washington, Pat Quinn of Illinois, Deval Patrick of Massachusetts, John Hickenlooper of Colorado, and Jerry Brown of California.
Not coincidentally, the four governors given an “A” are Republicans, while the eight “F”s are Democrats.
Gov. Walker did not make the cut. Instead, he earned a “B” from Cato, coming in eleventh place. He was particularly dinged because “actual spending increased 4.2 percent in 2013 and an estimated 4.8 percent in 2014.”

Highest Rated Governors by Cato
Although it doesn’t list the expansion of Medicaid among its criteria for rating governors, Cato criticizes governors—particularly Republican governors–who accepted the federal money to expand Medicaid. The three lowest-ranked Republican governors—Snyder of Michigan, Kasich of Ohio, and Scott of Florida—all supported expansion of Medicaid, suggesting that this crept into the ratings.
Did the governors awarded “A”s by Cato have a noticeably positive effect on their states’ economies? And did states whose governor was awarded an “F” suffer? To explore that question, I looked at each state’s percentage growth in employment between December 2010 and December 2014. The first graph shows the percentage growth of the four “A” states plus the next highest “B” states. For comparison, the percentage increase for the US as a whole is shown as an orange line. The most notable pattern is that there is no overall pattern; some states have high growth and others low.
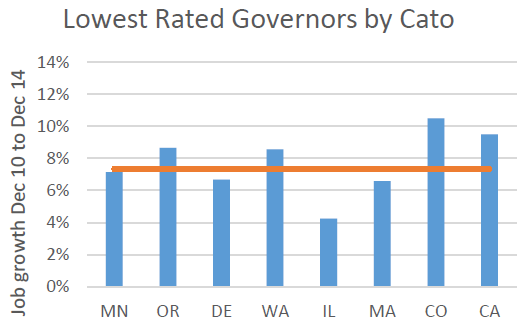
Lowest Rated Governors by Cato
The next graph shows percentage employment growth over the same period in the eight states whose governors received a grade of “F.” There is also considerable variation but less so than in Cato’s highly-rated states. Even poor Illinois, plagued by the nation’s most underfunded state pensions, had better job growth than several of the states whose governors rated “A.”
Overall, the eight states whose governors rated “F” had average job gains of 7.73 percent over four years, compared to gains for the whole US of 7.34 percent during the same period. The four states with “A” governors had average gains of 5.80 percent. Adding the four states with the highest-rated “B” governors had a negligible effect, giving us eight states with a 5.77 percent annual job growth, despite the inclusion of fast-growing Texas.
The difference between the two groups of states is statistically significant at the 90 percent confidence level.
One possible objection to this analysis is that it reflects job growth over the full four years, whereas the Cato report refers to budget actions after 2012, midway through that period. Presumably any impact of these actions would show up late in the period. Are there signs of curve-bending?
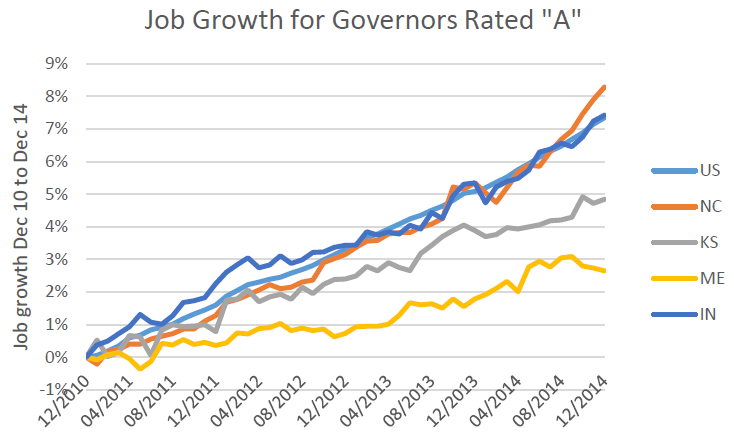
Job Growth for Governors Rated “A”
The chart to the right plots job growth over the four-year period for states with governors rated “A” by Cato. If there is an effect, it’s hard to see. Perhaps Cato could point to the late upturn in North Carolina, but then it would have to explain the late downturn in Maine.
Kansas, rated second best by Cato, has been in the news lately. First it was because of Governor Brownback’s very aggressive tax cutting, particularly cutting the state income tax and eliminating all taxes on the income of businesses that report income on their owners’ tax return. More recently, the news has been about the budget crisis caused by the governor’s tax cuts, resulting in cuts to education and the delay or reversal of some of the cuts. As the chart shows, the budget pain has not resulted in more jobs.
The next chart shows job growth in the eight states given an “F” by Cato. Again it is hard to see an effect from budget changes after 2012. Delaware might be an exception but not in a way that Cato would like. Note that in this and the previous plot I have listed the states in the order of the scores given by Cato so that California received the worst scores.
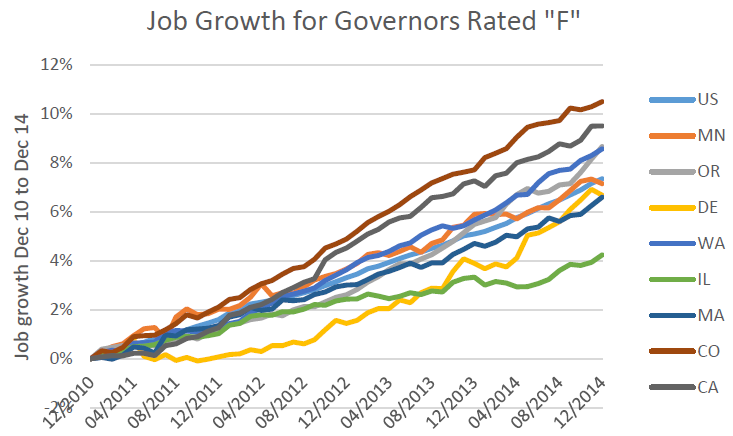
Job Growth for Governors Rated “F”
Minnesota, given an “F” by Cato, has received considerable attention in Wisconsin since it has outperformed Wisconsin on most measures.
Besides Minnesota, many of the states on the “F” list often head lists of states ranked high for innovation and entrepreneurship, notably California, Colorado, Massachusetts, Washington, and Oregon.
It is important to keep in mind the inherent limitations of any analysis of this kind. It is very possible that results would vary depending on the time period or states chosen for analysis, but it does provide a clear test of Cato’s rankings.
In discussing the actions that led to high ratings for governors, Cato shows no concern for the effect on Income inequality, which has grown in recent years. Reducing income taxes while leaving sales taxes untouched means shifting the costs of government from wealthy people to those with middle and low incomes. Reducing the number of income tax brackets generally does the same. At a time when there’s growing concern about income inequality, the enthusiasm for policies that would worsen it is puzzling.
Even from a hard-boiled revenue raising viewpoint, shifting taxes from those gaining wealth to those just holding on seems counter-productive. A recent study concluded that if Wisconsin taxed those in the top 1 percent at the same rate as those in the middle 20 percent, it would have increased revenues last year by $383 million. Because Wisconsin’s taxes are already close to progressive this is small potatoes compared to other states. If Illinois were to tax its 1 percent at the same rate as its middle 20 percent, revenues would increase by almost $7 billion; applying this same rule to the top 20 percent would bring in another $14 billion, going a long way to solve its pension crisis.
Wisconsinites can perhaps take comfort that they aren’t alone. Disappointing results in this state are reflected in other states implementing policies advocated by organizations like Cato. Models of reality are useful, and can help us understand how the world works. The danger comes when the model becomes hard doctrine, immune to any evidence to the contrary. The evidence from Wisconsin and the states suggests that the economic model promoted by organizations like Cato needs grounding in evidence.
Data Wonk
-
Scott Walker’s Misleading Use of Job Data
 Apr 3rd, 2024 by Bruce Thompson
-
How Partisan Divide on Education Hurts State
 Mar 27th, 2024 by Bruce Thompson
-
Will Wisconsin Supreme Court Legalize Absentee Ballot Boxes?
 Mar 20th, 2024 by Bruce Thompson